Unlock profitable DTC growth tactics with LMNT’s sampler and apparel gift strategies. Boost LTV, reduce churn, and turn buyers into loyal fans—learn how!
Read MoreHow to Find and Multiply Your Best Customers
Picture two DTC founders.
Founder A is obsessed with growth hacks—dumping dollars into Meta ads, chasing vanity metrics like impressions and “awareness,” celebrating when the top of the funnel looks full. Six months later? Sales are flat, margins are gone, and the CFO is asking where all the cash went.
Founder B takes a different path. Instead of chasing more, they dig into their customer data. They notice a pattern: a small group of buyers doesn’t just purchase once—they come back again and again, and each order is 5x larger than the average. This 20% drives the majority of their profits.
The difference is night and day. Founder A is broke and frustrated. Founder B is scaling confidently, with predictable cash flow and marketing that pays back fast.
That’s the power of knowing your star customers. And in this article, we’ll show you exactly how to find them—and how to multiply them—so every dollar you spend fuels profitable growth.
How to Identify the Features of Your Star Customers
If Founder B’s secret was spotting patterns in customer behavior, this is where you start.
The first step is simple: collect the right data. At a minimum, you’ll need transaction history (who bought what, when, and for how much). If you can, layer in acquisition data (where they came from—ads, referrals, organic search, etc.). Together, these show you what drove the purchase and who’s behind it.
The second step is segmentation. Don’t lump everyone together—separate customers by meaningful traits. You can segment by:
- Shipping address (geography matters)
- First product purchased (entry SKU patterns)
- Marketing channel (where they were acquired)
- Demographic overlays (the most powerful lens)
Demographic overlays take you beyond raw numbers and into customer DNA. They reveal who your most profitable buyers actually are and what messaging resonates. Think about the difference:
- “Empty-nesting middle-class boomers living in the suburbs”
- “Affluent families in higher-priced suburbs near the city center.”
Both groups buy, but the tone, channels, and offers that win them over are completely different.
Once you aggregate and visualize this data, you can generate reports that make your star customers impossible to miss—and give you the blueprint for finding more just like them. In the next section, we’ll break down a sample report and show how it uncovers can’t-miss insights about your star customers.
Customer Persona Breakout Report
Below is an example Tableau report built from the simple dataset you pulled together in the previous section. Let’s walk through what it tells you and why these metrics matter, with specific callouts to focus your attention.

Metrics That Matter
Profit (North Star Metric) Profit is the ultimate measure of whether your marketing is working. If LTV – CAC < 0, you’re losing money—period. Everything else rolls up to this.
Lifetime Profit (LTV) LTV shows how much profit a customer contributes. Here, we zoom in on 30-day lifetimes to emphasize cash flow growth.
Formula: (Product Revenue – Product Cost) ÷ Customers
Customer Acquisition Cost (CAC) CAC is the other half of the profit equation—what you pay to acquire a customer in this segment.
Formula: (Spend by acquisition channel in a given month) ÷ (New customers acquired in that channel/month)
Conversion Rate (Conv.) Conversion rate is your reality check: does this segment actually resonate with your product and messaging? You can drive traffic, but if they don’t convert, it’s wasted spend.
Formula: Customers ÷ Leads
Percentage of Total Profit (% Total Profit) This metric shows the overall weight of each segment on your bottom line. If you cut this group, how much profit disappears? If you double down, are you making progress?
Report Takeaways
Following the Pareto principle, we’re zeroing in on the top 20% and bottom 20% of our customers. Here’s what stands out:
- Profit Gap: The top 20% outperform the bottom 20% by ~16.6%. That’s not marginal—that’s game-changing.
- Driver of Profit: Most of the gap comes from higher LTV, not lower CAC (acquisition costs are roughly in line).
- Conversion Rate: The top 20% convert at 12%, while the bottom 20% sit at 9%. Three points may look small, but scaled across thousands of leads, it’s a massive swing in revenue.
Table Insights: Best vs. Worst Performers
The table below sorts segments by profit performance and shows where each sits in the 20-60-20 groupings. Four segments jump out:
Potential Targets
- Cultural Heritage – Highest profit margin, tiny share of total revenue (room to scale). Weak spot: lower conversion rate, so deeper testing is needed before doubling down.
- Asian Communities – Strong profit, aligned CAC, and a healthy conversion rate. This segment is signaling demand—we should actively target and expand here.
Cut Candidates
- Workforce Warriors – Low profit but surprisingly high conversion rate. Could be bargain-hunters who buy cheap and drain resources. Needs validation before final judgment.
- City Gentleman – Weak across the board: low profit, low conversion, low total impact. Clear candidate for cutting so resources can shift to higher-return groups.
Now that we’ve identified which segments drive profit and which ones drain it, the next step is clear: target the winners, cut the losers. In the following section, we’ll lay out exactly how to find locations that double down on your best segments—and avoid wasting money on the rest.
Where do I find my best customers?
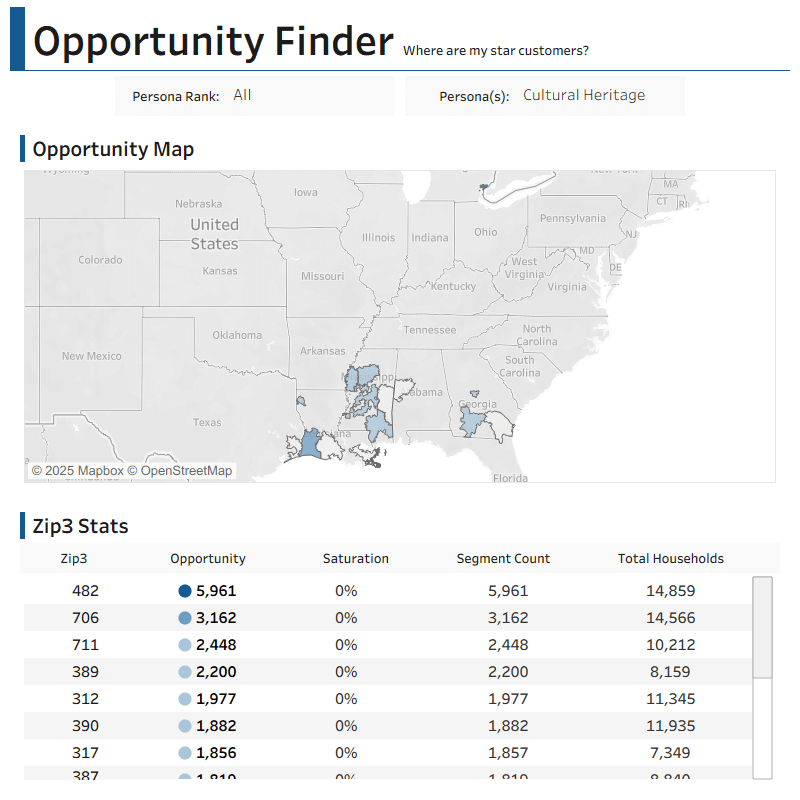
Now that we have identified some potential cut/expand candidates the question becomes how do we find areas that are full of our top candidates. The second page of our report called the opportunity finder shown below delivers on this.

Metrics That Matter
To prioritize which customer segments to target—or cut—you need a handful of simple but powerful metrics:
- Opportunity – The size of the untapped market. Calculated as the total number of people in a segment minus the number of customers you’ve already sold.
- Saturation – How much of the segment you’ve already captured in a given location. High saturation = diminishing returns.
- Segment Count – The raw population size of your selected segment(s) in that location.
- Total Households – Census-listed households in the location, giving context for overall market size.
Takeaways from the Dashboard
Using this dashboard, we can drill into one target segment and one cut candidate from our earlier analysis:
Cultural Heritage (Potential Target): Filtering for “Cultural Heritage” highlights Zip3 areas in the Deep South with high opportunity and low saturation. That means plenty of untapped customers. Campaigns here should prioritize this persona with messaging that speaks directly to cultural identity and heritage values.
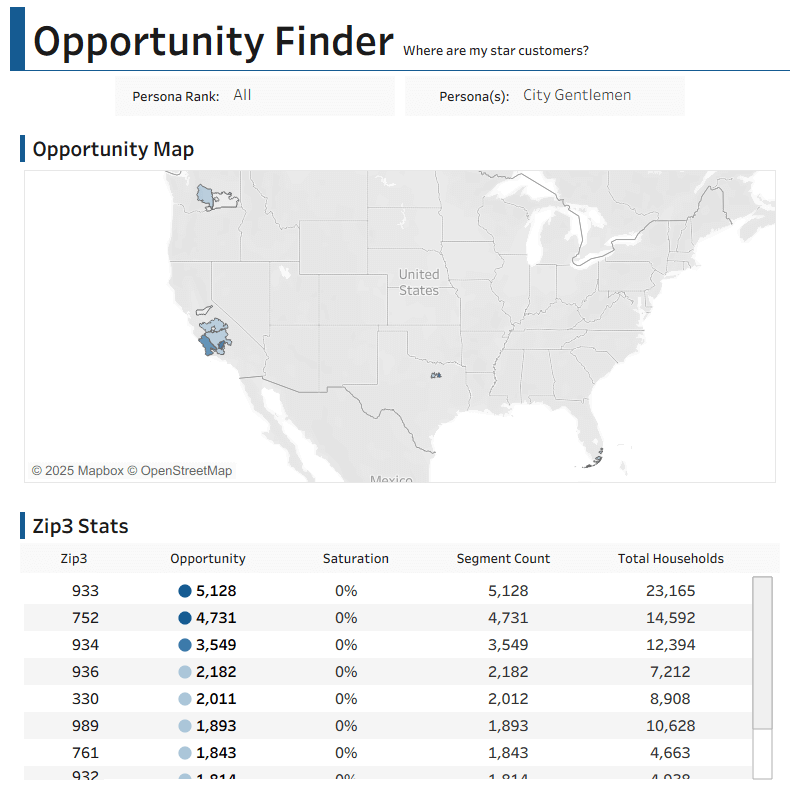
City Gentleman (Cut Candidate): Filtering for “City Gentleman” shows Zip3 areas where this group is present, but profit and conversion remain weak. The smart move is to de-prioritize or remove these areas from campaigns. If you keep them in play, it should only be for testing fresh offers or upsells that could rescue segment profitability.
The difference between Founder A and Founder B comes down to one thing: clarity. When you know who your star customers are, what makes them different, and where to find more of them, your marketing shifts away from guesswork. The data doesn’t just tell you who’s buying—it shows you where to focus, which segments to cut, and which ones can fuel sustainable, profitable growth.
If you want a report like this—custom-built to uncover your star customers and the markets where they live—book time with one of our experts today. We’ll walk you through your own customer DNA, highlight your top-performing segments, and hand you a clear playbook for targeting them with precision. Don’t keep pouring dollars into the black box—book your session now and turn your data into a growth plan that pays back fast.
From Chaos to Confident Growth
The difference between Founder A and Founder B comes down to one thing: clarity. When you know who your star customers are, what makes them different, and where to find more of them, your marketing shifts away from guesswork. The data doesn’t just tell you who’s buying—it shows you where to focus, which segments to cut, and which ones can fuel sustainable, profitable growth.
If you want a report like this—custom-built to uncover your star customers and the markets where they live—book time with one of our experts today. We’ll walk you through your own customer DNA, highlight your top-performing segments, and hand you a clear playbook for targeting them with precision. Don’t keep pouring dollars into the black box—book your session now and turn your data into a growth plan that pays back fast.
Looking to supercharge your business with data analytics? Check out these articles next.

Why Do American-Made Brands Keep Losing Money to Hidden Wastage?
As an American-made manufacturer, you've relentlessly optimized your production line, yet three hidden wastage points beyond your view still threaten your profitability and even your business survival.
Read More
Performance Measurement for DTC Marketing: Kill Vanity Metrics
Escape the hamster wheel of vanity metrics—learn exactly which KPIs actually drive your revenue and align your team toward measurable growth.
Read More