Propensity models are a group of statistical models that provide immense value to your organization.
Read MoreAmerican-made DTC brands can’t afford to fly blind. With rising acquisition costs, evolving consumer expectations, and the need to stand out in a crowded market, success depends on more than just passion and product quality-it demands data-driven decision making. That’s why the most profitable DTC brands treat their marketing like a production line, tracking the right metrics and using them to power every move.
This article breaks down the six essential marketing metrics every American-made DTC brand should track to maximize every marketing dollar. You’ll learn not only what to measure, but how to turn those numbers into actionable KPIs through meaningful benchmarks, and how a simple dashboard makes performance crystal clear. Want to rip open the marketing black box and outsmart those low-cost foreign rivals? Keep reading.
To systematize marketing like a production line, American-made DTC brands must focus on a core set of metrics that ultimately drive profitability. Here’s a breakdown of the six essential metrics, how to calculate them, and why they matter specifically for U.S. based direct-to-consumer brands.
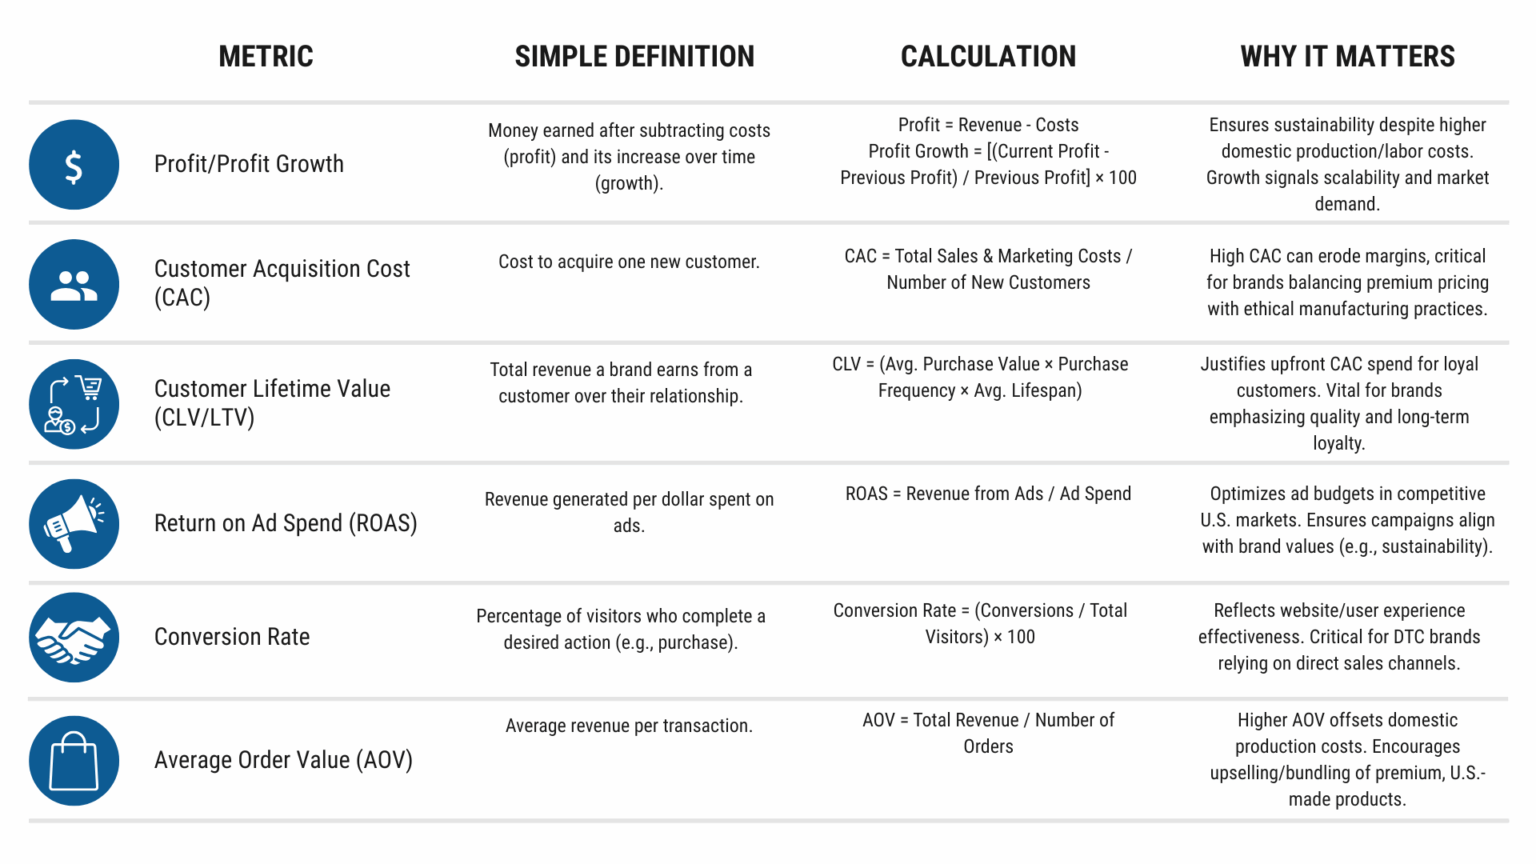
Mastering these six metrics—Profit, CAC, LTV, ROAS, Conversion Rate, and AOV—becomes the unyielding clarity that crushes the dread of watching hard-earned dollars vanish into a black hole of guesswork. When you track and optimize each one, you ensure that every marketing dollar works harder. The next section will show you how to operationalize these metrics.
One of the most common pitfalls for DTC brands is confusing metrics with KPIs-treating raw numbers as indicators of success without any context or comparison. A metric, like “our conversion rate is 2.3%” or “our average order value is $85,” is just noise unless you can measure it against something meaningful.
To transform a metric into a true Key Performance Indicator, you need to benchmark it against your own history, industry standards, or specific business goals. If you’re struggling to set these benchmarks, try these three practical approaches:
This method is ideal when you have some historical data or industry knowledge to draw from, but need a starting point.
How to Do It:
Why It Works: Even a rough, experience-based target is better than none. It provides immediate context and a baseline for improvement.
Example: If your DTC brand had a 4.2% conversion rate last Black Friday and you’ve increased your ad spend this year, set a KPI of 4.5–5% for the upcoming event.
Bracketing is a collaborative approach, perfect for teams who need to align on what’s realistic and what’s aspirational.
How to Do It:
Why It Works: This method encourages team alignment and ensures your targets are both ambitious and achievable.
Example: For CAC, your team agrees $5 is too low for your industry, and $500 is unsustainable. Through discussion, you settle on an $80 target CAC.
When launching new campaigns or products with no historical data, it’s better to start somewhere than nowhere.
How to Do It:
Why It Works: A provisional KPI gives you direction and focus. As you gather data, you can refine your targets for greater accuracy and relevance.
Example: A new DTC skincare brand sets an initial conversion rate KPI of 2%. After three months, they’re consistently hitting 2.8%, so they raise the KPI to 3% as a new stretch goal.
Benchmarks transform raw metrics into true KPIs by giving them context-whether it’s your own historical performance, industry standards, or team-aligned targets. This process ensures every number you track is actionable and directly tied to your growth objectives.
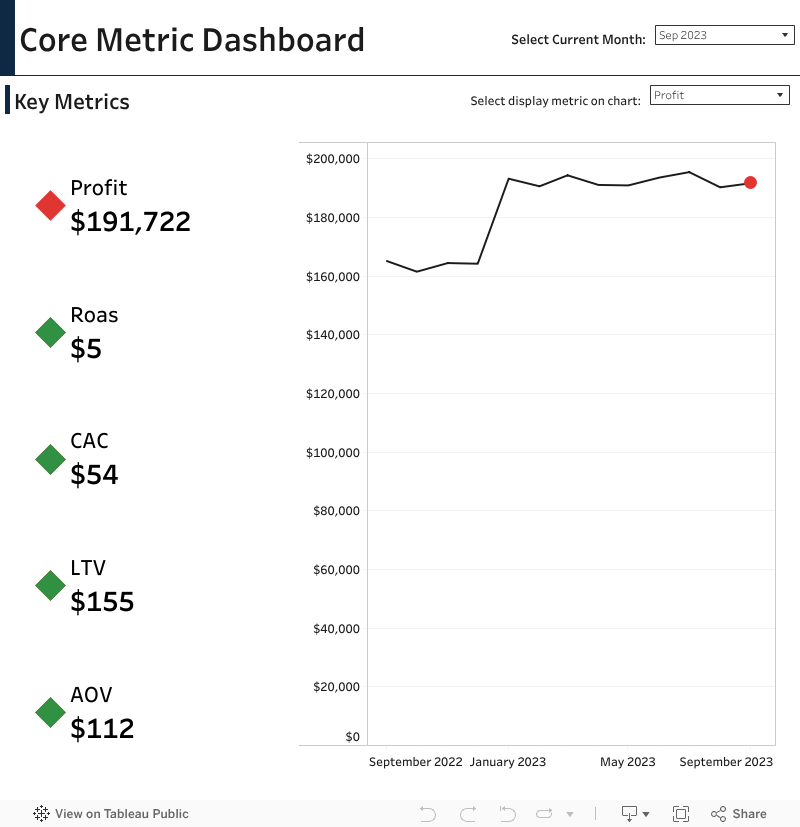
A dashboard acts as your business’s command center, consolidating critical data points-like profit, ROAS, CAC, LTV, and AOV-into one clear, actionable view. This unified approach eliminates the need to chase down numbers across spreadsheets or platforms, making it easier to spot trends, diagnose issues, and make fast, informed decisions.
The dashboard shown here is a super simple, practical version of KPI tracking that delivers instant clarity. Each metric is paired with a colored diamond to show if you’re meeting your benchmark at a glance-green for on target, red for below expectations. You get the current month’s data right next to each metric, so you always know where you stand, and the time series chart visualizes trends over the past year, helping you see both progress and potential red flags.
In summary, building a production-line approach to marketing starts with tracking the right metrics: profit, CAC, LTV, ROAS, conversion rate, and AOV. Benchmarking them to make meaningful KPIs. And finally, visualizing these in a simple dashboard to give your team instant clarity on performance. If you implement these simple steps, you will say goodbye to sleepless nights watching marketing dollars vanish and ignite your profit engine.
If the advice from this article didn’t give you the answer you need to win the war against cheap Chinese crap, then click here to schedule a free call with us. We’d be honored to assist you with some customized, free guidance so you can continue to serve the communities you support so well.
Oh, and if you found this article helpful, please share it with another American Manufacturer that could benefit.
Propensity models are a group of statistical models that provide immense value to your organization.
Read MoreAs an American-made manufacturer, you've relentlessly optimized your production line, yet three hidden wastage points beyond your view still threaten your profitability and even your business survival.
Read MoreBreak Open the Black Box—Unlock the Power of Sales Attribution for American-Made DTC Brands.
Read MoreNEED HELP ON AN APPROACH TO TRACK THE RIGHT METRICS? WE’D BE HONORED TO PROVIDE SOME CUSTOMIZED FREE GUIDANCE.