Discover the impact of customer lifetime value (CLV) on your business success.
Read MoreIf you’re building a DTC apparel brand rooted in American manufacturing, you’re not just selling clothes—you’re selling values. But even the strongest mission won’t protect your margins if you can’t track what’s working.
Thomas Jefferson once said, “To be independent [sic] for the comforts of life, we must fabricate them ourselves…He therefore who is now against domestic manufacture must be for reducing us either to dependance [sic] on that foreign nation, or to be clothed in skins.”
That mindset still echoes today for brand owners who are committed to building domestically. But independence doesn’t stop at the factory floor. If you want to control your growth, you need to master your data.
Most founders get this wrong. They obsess over creative, copy, and community, but their analytics? An afterthought. Yet in today’s landscape—rising ad costs, fragmented attribution, and fickle customer loyalty—brands that win are the ones with data dialed in.
This article breaks down the exact analytics strategies that separate the seven-figure brands from the ones that stall out. Whether you’re still stitching together your first campaigns or scaling your third fulfillment center, you’ll learn:
Let’s turn your gut instincts into a data advantage—so your American-made brand doesn’t just survive, it thrives.
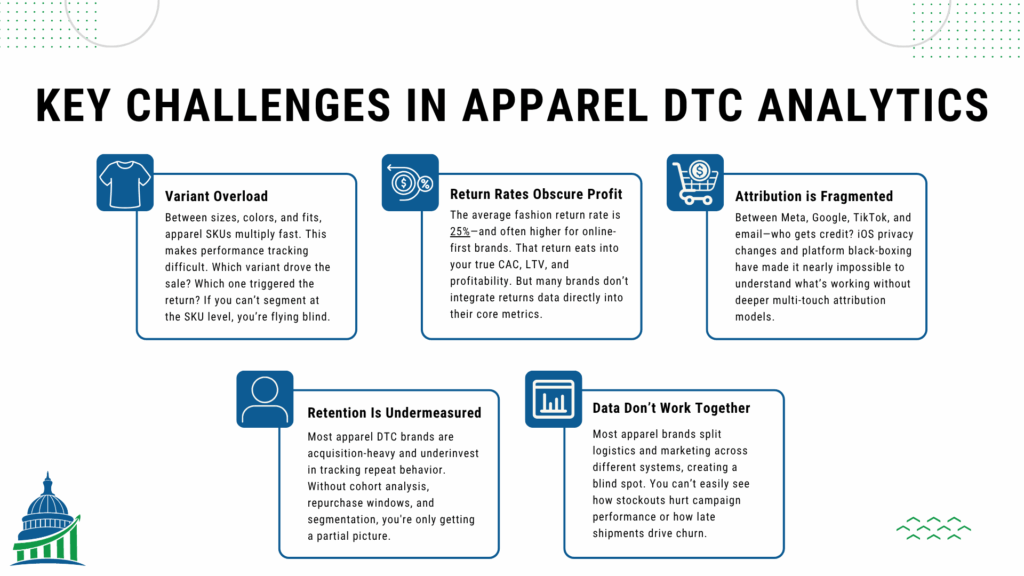
Running an apparel DTC brand sounds straightforward—until your attribution breaks, your returns skyrocket, and your funnel becomes a black box. Here are the top challenges holding back most fashion-focused DTC brands from making informed data decisions:

Knowing these landmines is the first step. The next is building strategies to navigate them—which is exactly what we’ll cover next.
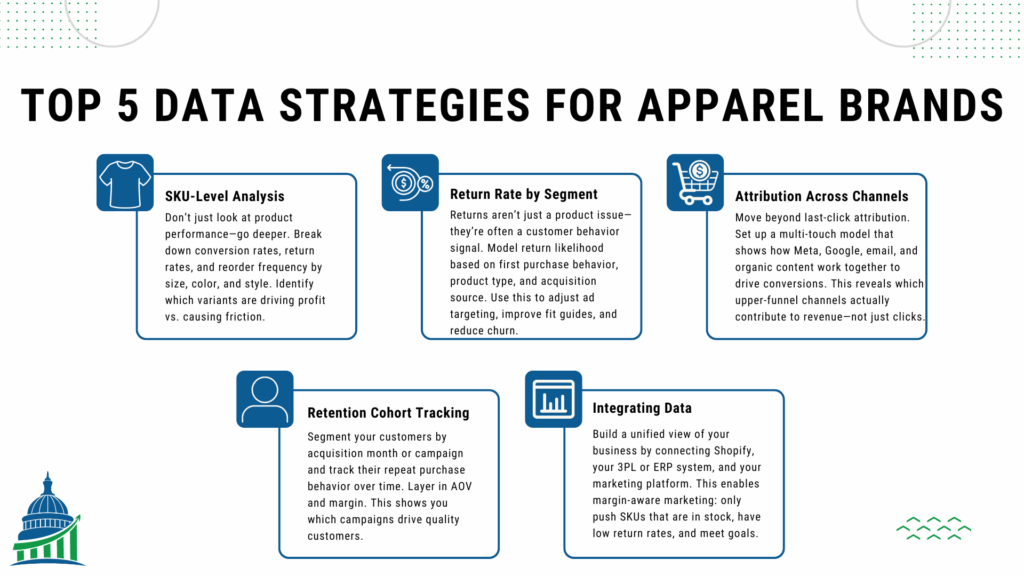
Data isn’t just about dashboards—it’s about decisions. The five strategies below are built to directly solve the exact problems we just outlined: SKU chaos, runaway returns, attribution black holes, low retention visibility, and disconnected systems. These approaches help apparel DTC brands turn fragmented information into focused action—driving smarter campaigns, healthier

Use these strategies not just to observe your business—but to optimize it. Next, we’ll look at a real brand applying these tactics in the wild.
Celeste was on a roll. She led a fast-growing women’s apparel brand rooted in American values—doubling revenue year-over-year and recently landing a major deal with a well-known national retailer. Orders were up. Exposure was through the roof. But beneath the surface, something wasn’t adding up.
Returns were climbing—fast. And worse, there was no clear signal why. The retailer was sending Celeste order and return data, but it came as inconsistent spreadsheets—different formats, different column structures, and no SKU-level cohesion. Her team was buried in Excel hell trying to manually piece together which products were coming back and why.
It was a low point. Growth was supposed to feel like momentum—not chaos.
Celeste made the call to fix it. She worked with her team to automate data cleanup and unify all retail and DTC returns into a single, SKU-level dashboard. What they found surprised them: a disproportionate share of returns were coming from plus-size customers who were ordering multiple sizes in the same style and returning the ones that didn’t fit.
Instead of treating this like a product failure, Celeste saw an opportunity. Her team updated the product pages and created improved size guidance specifically for plus-size shoppers—offering clearer fit expectations, real-customer reviews, and visual references.
The result? A 12% drop in return rates over the next quarter.
Celeste’s story is a perfect example of what happens when operations and analytics work together—and why investing in data is not just a cost center, but a growth lever.
American-made DTC apparel brands aren’t just competing on quality—they’re competing on clarity. And clarity comes from your data. In this article, we explored the biggest analytics challenges facing apparel founders today—SKU chaos, return rate ambiguity, fragmented attribution, retention blind spots, and siloed systems. We walked through five high-leverage strategies that turn these problems into performance wins, and we saw how one founder, Celeste, used this exact approach to drive a 12% reduction in returns in a single quarter.
The key takeaway? Your growth ceiling isn’t set by your ad budget or product line—it’s set by how well you understand what’s actually happening in your business. Data isn’t a luxury for big brands. It’s the edge small and mid-sized American manufacturers need to win.
What are the most important metrics for DTC apparel brands to track? Focus on SKU-level performance, return rates by customer segment, multi-touch attribution performance, retention cohorts, and margin-per-SKU. These give you operational and marketing clarity.
How can I reduce returns without hurting conversion rates? Use returns data to identify patterns (like sizing confusion) and proactively address them with better product information, size guidance, and customer segmentation.
Do I need advanced tools to implement these analytics strategies? Not necessarily. Start by integrating Shopify, your fulfillment data, and marketing platforms. Even a clean Google Sheet or basic BI tool can get you 80% of the way there.
How often should I review my analytics reports? Weekly for tactical actions (campaign performance, stockouts), and monthly for strategic insights (cohort behavior, return trends, margin analysis).
What’s the first step for a brand that feels behind on analytics? Start by cleaning and centralizing your data. Build a single source of truth that includes order, return, and marketing data. From there, build simple reports to spot your biggest friction points.
Discover the impact of customer lifetime value (CLV) on your business success.
Read MoreAs an American-made manufacturer, you've relentlessly optimized your production line, yet three hidden wastage points beyond your view still threaten your profitability and even your business survival.
Read MoreDitch the dashboards that only show you yesterday—predictive analytics gives American-made DTC brands the power to stop CAC bleed, prevent churn, and unlock true customer lifetime value.
Read More