Case Study: How Automating Call Data and Performance Tracking Boosted Sales Leads and Achieved Revenue Goals
Why are we not getting enough leads to meet our sales goals? The CEO was nervously watching as their pipeline began to shrink. Their company was struggling to meet their revenue goal as the market began contracting and the CEO knew that a high performing sales team was critical to meet this year’s growth goal. The CEO brought in the sales manager to understand the problem better. The CEO asked the sales manager “why is the pipeline dwindling?”
The sales manager believed the team was working harder to meet the revenue goals but it was hard to tell because they were using two calling platforms, Dialpad and Salesloft. The sales manager had a limited view of each sales officer’s performance because their calls were split between the two systems.
The manager needed to spend 2 hours exporting data from the tools into Excel to create a summary view of the day-to-day performance. He wanted to set a performance goal to hold his sales officers accountable, but how would he set a realistic goal and transparently track it? The manager was left with a Sophie’s choice: spend time on manual tasks to understand performance or spend time coaching reps and connecting with potential customers.
The CEO and Sales Manager knew they needed to get their hands around the data and free up the sales manager, so they reached out to CDA. We partnered with the CEO and sales team to deliver on the following:
- Centralize call data from Dialpad and Salesloft
- Build a daily call goal to hold sales reps accountable to filling the pipeline
- Automate reporting that showed sales team performance
In this case study, you will find the following: 1) The pain points the solution solved; 2) the results the sales team accomplished; and 3) how you can solve this problem with automation. At the end of the case study, you will find a bonus – a free download of both the Tableau dashboard or an Excel version that you can implement to track your sales team’s call performance.
Pain Points Worth Solving
The sales team you heard about earlier is much like other sales team’s we work with around the nation. Those teams are saying:
It is harder this year than last year and silos are keeping us from being effective.
Quota attainment went down 10 percentage points to 53% in 2023 and only 17% of sales people think they will hit their target in 2024. The landscape is getting harder and sales teams have to adapt by selling across multiple channels, managing supply chain issues, fighting inflation, maintaining sales representatives,… the list goes on and on.
Adaptation meant that new tools were brought online that don’t talk to each other and added new reporting tools to an already over-tooled environment. The sales team you heard about before decided to consolidate their reporting to provide an accurate and wholistic picture. They are part of the wave of sales organizations that are consolidating their tech stack to become more effective and reduce business slowing silos.
We need to do more with the same or less.
Sales leaders say they are struggling to get the budget they need, yet high performing sales teams know that Sales is critical to meeting revenue growth goals. One of the easiest ways to do more with less is spending more time selling rather than doing tedious tasks that could be automated. The State of Sales Report 2024 found that sales reps spend only 28% of their week actually connecting with prospective customers. The rest, 31 hours per week, is spent on tedious tasks like deal management and data entry.

The sales manager found this with his reporting. He had to give up 16 hours per week to create an essential report, or fly blind but spend time on selling.
3. We need to set a realistic goal and hold our sales officers accountable.
Holding sales officers accountable to a goal is critical to meeting sales and revenue growth. Setting a realistic goal and transparently tracking performance to the goal is a challenge worth solving.
Sales Leaders, Sales Ops, and Sales Reps say the same thing: unrealistic sales goals are a top 5 reason for leaving a company. Moreover, coaching is integral to retaining sales reps.
Having an accurate and holistic picture of your day-to-day operations is critical to setting a realistic goal. You will find how we set a realistic goal for this sales team and tactics you can use for setting realistic goals in the following sections.
Freeing up a sales manager from manual tasks allows the manager to spend time coaching – making sure the team is operating as effectively as possible.
Results
Centralized Data and Increased Revenue
CDA centralized the call data, established reasonable goals, and rolled out an automated Tableau report in just three weeks. The sales team, sales managers, and the CEO now received a daily report in their email without lifting a finger. The daily report aligned the business on what needed to be done to refill the pipeline leading to more sales.
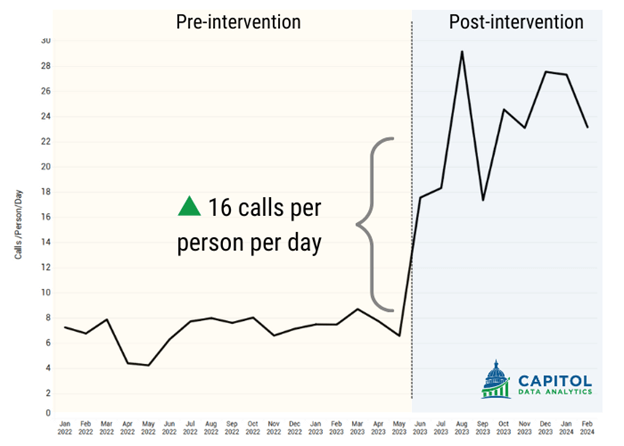
The sales team more than tripled the number of calls being made contributing to a $140,000 increase in revenue over a year. Overall, the lender’s ROI on the project was $16:1.
Did more without increasing headcount
The sales team averaged 7 calls per person per day prior to the intervention and over 23 calls per person per day after the intervention. The increase in effort to meet the sales goal occurred in weeks driving more leads into the pipeline. The image below demonstrates the impact of focusing on an action and effectively measuring the action had.


3. Held their sales officers accountable by setting realistic goals
Setting achievable revenue goals based on top performers and the business revenue goal fostered clear expectations between management and sales officers. Level setting expectations and being able to show sales officers that other teammates where achieving the goal helped reinforce that the goal is attainable. It was up to them to put in the effort.
Providing daily call reports enabled sales managers to hold the team accountable, leading to consistent progress toward the goal. Sales officers started increasing calls immediately after the report was released. This transparency allowed the CEO to observe advancements in both call volume and pipeline development.
CDA’s Steps To Building The Solution
Now that you saw what the outcome was for the lender, the question is how did CDA deliver on the three goals we had:
- Centralize call data from Dialpad and Salesloft
- Build a daily call goal to hold sales reps accountable to filling the pipeline
- Automate reporting that showed sales team performance
Below you will find a section for each one of these bullet points, with a description on how we delivered.
Centralizing Call Data From Dialpad and Salesloft
We used Google’s Cloud Functions to schedule and execute a Python script that returned daily data from SalesLoft and Dialpad’s API. The python scripts pull the data and structures it into a csv file that is formatted and dumped into a staging directory. The file is then validated to make sure the schema is correct and it is then loaded to Google BigQuery (Cloud Database).
Essentially, this is like building a robot whose mission is to go to SalesLoft and Dialpad each day and ask for the prior day’s data. The robot checks the data for accuracy and formatting and then adds it to the data warehouse. This is very similar to how you would do it manually, but its better because you are not doing it. Below is a process flow of how this all works.

Build A Daily Call Goal
The next goal was to build a daily call goal. This goal was imperative to aligning team members on the expectation for the number of calls to be made. We blended together historical data and deductive reasoning approaches to create this goal.
Historical Data Approach
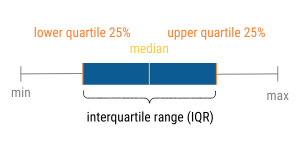
We were able to examine the best sales officers’ actions over time now that we had the data in one location. We used Tableau to build box-and-whisker plots of these high performers’ daily calls. The box-and-whisker plots provide you with an understanding of the median (e.g. average number of daily calls) and the interquartile range (e.g. the number of calls that represents the 75% and 25% most calls in a day). This view helped us understand what a reasonable goal would look like by seeing the range of calls being made.

Deductive Approach (Back of Napkin)
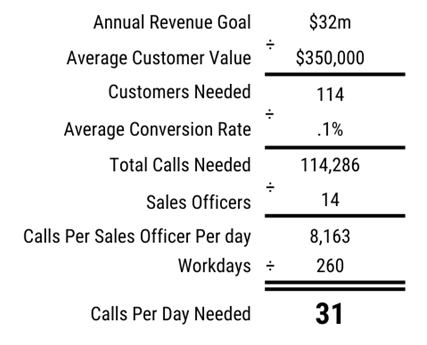
The purpose of the project was to hit a revenue goal, so it made sense to make sure the goal we were using would inevitably lead to meeting the revenue goal. To do this we used several years of call data to determine conversion rates. We also used CRM data to calculate average customer value. With these numbers in hand, we could math our way to a goal. A fictional example is displayed below.

Automate Reporting
With the data in place and a daily sales goal established, the next step was delivering a report via email every day to the sales team, sales managers, and CEO. We used Tableau to build the report that is demonstrated below.
A few advantages of Tableau that we utilized are:
- Tableau has a native connector to Google BigQuery and Google Sheets
- Allows you to automatically refresh on a schedule
- Allows you to query the data with Custom SQL Queries to join the data
- Allows you to join together external data sources like Google Sheets
- Tableau Online gives you the ability to auto generate emails based on when the data refresh
- Tableau has ultimate customizability to allow you to create effective visualizations to simplify the data and deliver instant understanding
- Tableau has a native connector to Google BigQuery and Google Sheets
This dashboard effectively displays the number of sales officers meeting the call goal and provides a stop light color scheme on the team’s performance. Each sales officer’s performance is then highlighted below to help understand who was complying.
The number of borrower conversations and capacity were added to the dashboard to provide additional context. We know that if you start measuring an action, people will respond. Dialing calls alone isn’t sufficient to convert leads, the quality of the call matters. Borrower conversations is a proxy for the quality of conversations that loan officers had. This proxy help managers keep an eye on whether sales officers need additional training to increase engagement or if a sales officer was gaming the system by dialing and hanging up to meet their goal.
We added capacity to understand how much of the sales officer’s available time was used by outbound calling. Overall, this can be helpful in determining the cost of leads and to make sure workloads across the team are properly managed.
If you would like to use a similar dashboard as the one displayed here, you are in luck. Click the button to download a zip file that contains the following:
- Explainer Videos (Link In Excel Document)
- Excel Sheet To Centralize Your Data
- Excel or Tableau Dashboard