Break Open the Black Box—Unlock the Power of Sales Attribution for American-Made DTC Brands.
Read More
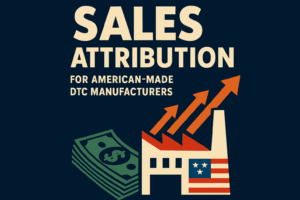
Break Open the Black Box—Unlock the Power of Sales Attribution for American-Made DTC Brands.
Read More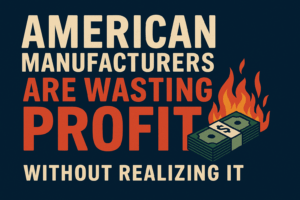
As an American-made manufacturer, you've relentlessly optimized your production line, yet three hidden wastage points beyond your view still threaten your profitability and even your business survival.
Read More
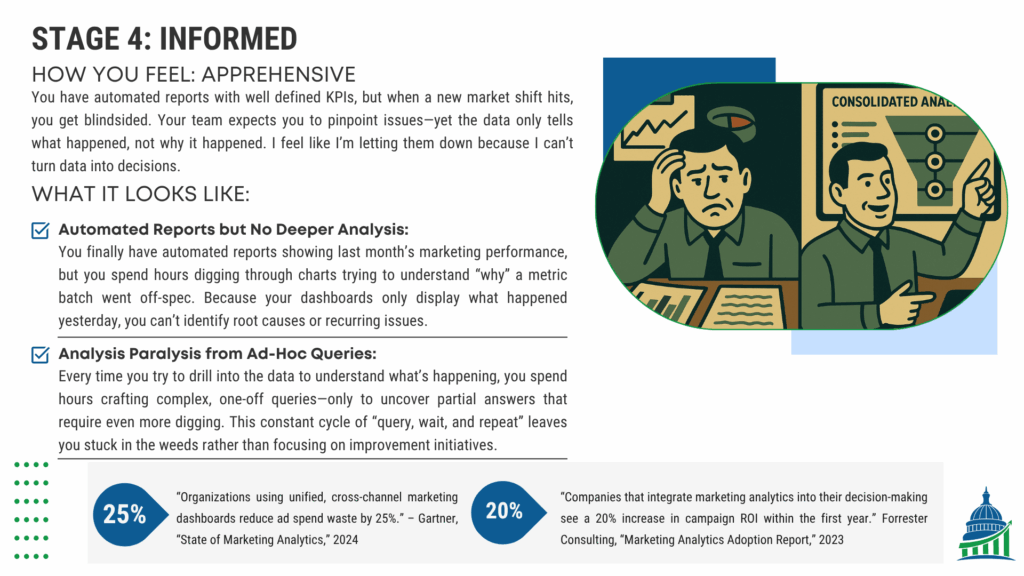
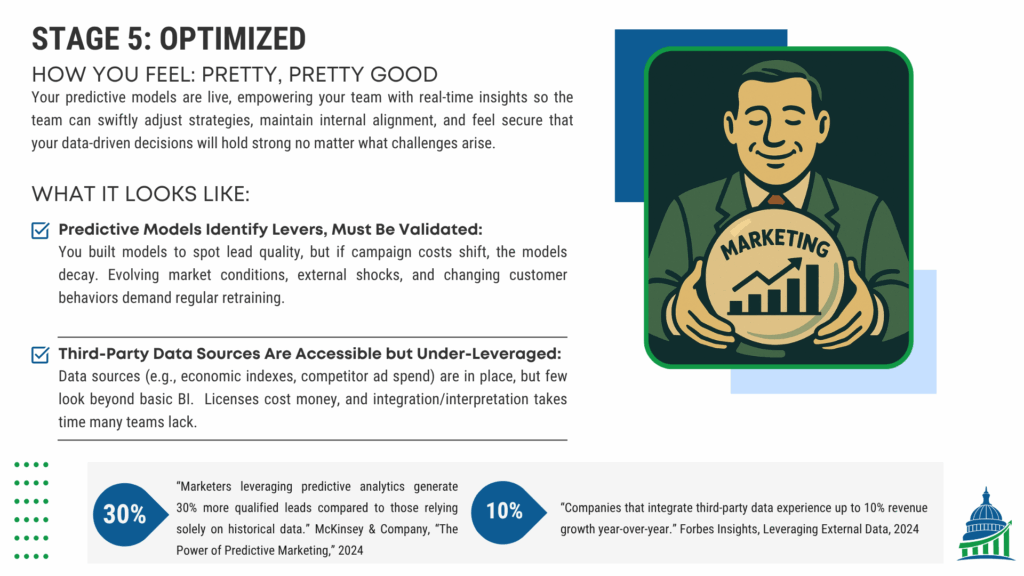
Escape the hamster wheel of vanity metrics—learn exactly which KPIs actually drive your revenue and align your team toward measurable growth.
Read More