As an American-made manufacturer, you've relentlessly optimized your production line, yet three hidden wastage points beyond your view still threaten your profitability and even your business survival.
Read MoreYou didn’t start your DTC brand just to make a quick buck—you built it to last. To build something your community could stand behind. But here’s the problem: if you don’t know exactly what you can afford to spend to get a new customer, that dream dies slowly. Not in some dramatic crash, but in the quiet despair of declining profit. This article exists for one reason—to end that despair. You’ll learn what numbers to trust, what benchmarks to beat, and how one founder turned confusion into confidence by putting this article’s framework into place.
If your business isn’t making a profit, it’s just an expensive hobby. So, when it comes to acquiring customers, you have to do it profitably. And profitable customers don’t happen by accident—it’s the outcome of ruthless clarity on two customer metrics: what it costs to get a customer (CaC), and what that customer is worth over time (LTV). If those numbers don’t add up, neither will your business. Forbes spells it out: brands with staying power hit at least 50% margins, meaning they get $1.50 back for every $1 spent acquiring a customer. Now that you know the target, it’s time to run the numbers. The next section gives you the straight and narrow on how to calculate CaC and LTV—so you can scale with confidence.
In general terms, LTV (Lifetime Value) measures the total dollar value a customer brings to your business over a specific time period—what we call their “lifetime.” While some businesses stretch that to 3 or 5 years, that’s playing a dangerous game with hopeful projections. For most DTC brands, the most reliable and actionable method is to calculate a profit-based 12-month LTV. Why? Because it keeps you grounded in reality. It ties directly to cash flow, customer behavior, and how fast your business can scale sustainably.
The best part? You don’t need fancy tools or predictive models to start. You can do this directly from your transaction-level data: just sum the actual profit generated by each customer in their first 12 months. Not revenue. Not gross sales. Profit. After subtracting your COGS and fulfillment costs, what’s left is what matters.
Simple. Clear. Powerful.
Here are two pro tips to make your LTV calculation bulletproof:
Track LTV by Acquisition Channel: Not all marketing sources are created equal. A Facebook ad might bring in high-volume, low-value buyers, while organic or referral traffic delivers whales. Segment your LTV by channel to see which acquisition strategies are actually profitable—not just popular.
Track Net Profit On Transactions: Focus on profit after COGS, shipping, transaction fees, and any fulfillment costs—but exclude the costs to acquire the customer (this is CAC). This gives you a clearer picture of how each customer performs on a marginal basis.
CAC is the total amount you spend on marketing and sales to acquire a single new customer. This includes ad spend, agency fees, email platform costs, even the salaries of your marketing team (if they’re dedicated to customer acquisition). When summed up and divided by the number of customers acquired, it tells you your cost per customer—pure and simple.
But don’t overcomplicate it. You don’t need a 10-tab spreadsheet. Just add up what you spent in one month on paid customer acquisition, and divide it by the number of new customers you brought in. That’s your CAC for that channel and that period.
Example:
Your CAC = $15,000 ÷ 300 = $50
That means it cost you $50 to acquire each customer.
Here are two pro tips to make your CAC calculation bulletproof:
Track CAC by Acquisition Channel: Don’t lump all spend together. Your Facebook CAC might be $60, while your influencer campaign is pulling in customers at $30. Segmenting by source helps you double down on what’s profitable and cut what’s just pretty.
Include All Acquisition Costs: CaC isn’t just your ad budget. It’s everything you spend to make a sale—agencies, software tools, promotions, even the time you or your team spends writing email sequences. Be honest about what it really costs, and you’ll have the clarity to grow with confidence.
Now that you understand the two sides of customer profit—what a customer brings in (LTV) and what it costs to acquire them (CAC)—it’s time to combine them into a single, powerful metric: the LTV:CAC ratio. Remember according to Forbes, lasting brands sport a 1.5 LTV:CaC ratio, but for truly healthy brands you should target at least 3. This gives you a healthy ratio that can not only roll with any punches but allow you to grow your operations.
Here is the calculation:
LTV:CAC Ratio = (12-Month LTV in Profit) ÷ (Customer Acquisition Cost)
That’s it. Profit in. Cost out. The result is your multiplier.
Example:
Let’s say you’re running a DTC brand selling handcrafted kitchen tools. After reviewing your numbers:
Now run the numbers:
LTV:CAC = $230 ÷ $90 = 2.56:1
Boom. You’re more than meeting the 1.5:1 baseline. In fact, you’re turning every $1 spent into $2.56 in profit over a year. That’s a green light to scale—with confidence.
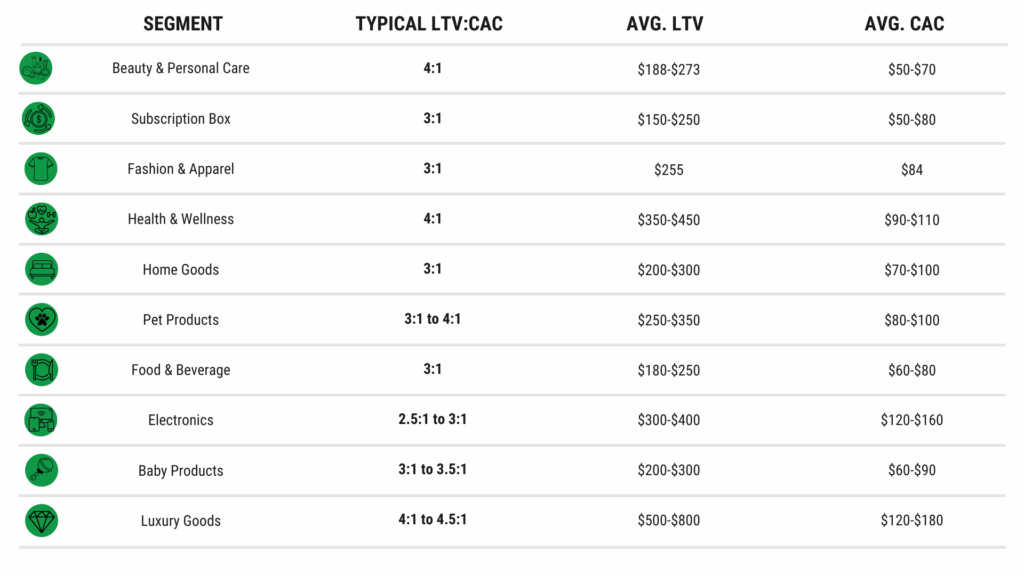
Yes, we’ve talked about 1.5:1 and 3:1 as key ratios—but not every brand is the same. Different DTC models operate at different margins, so the “right” LTV:CAC ratio depends on your category. Below is a table with average ratios across some of the most common DTC segments. Just remember: average is a starting point, not something to aim for. The job is to beat the benchmark.

So what should you pay to acquire a customer? The answer is crystal clear: whatever amount keeps your LTV:CAC ratio above 1.5—and ideally closer to 3.0 (or above the benchmarks above). If you’re bringing in $180 in profit over 12 months, then $60 or less is your max CaC. If your CaC creeps above that, you’re not scaling—you’re slipping. This ratio is your guardrail, your growth signal, and your early warning system. Track it ruthlessly. Align your team around it. And never again wonder whether you’re spending too much to grow—because now, you’ll know. Next is an example how Josh, did exactly that after initially stumbling.
Josh ran a thriving American-made outdoor kitchen brand out of small-town New Hampshire. He took pride not just in the product, but in providing for the 35 families his business supported. But when lead costs started rising, his marketing team made a well-intentioned decision—they slashed spend in higher-cost geographies. On paper, CaC dropped. Victory, right?
Not even close.
What they didn’t realize was that those higher-cost markets were also their highest-converting ones. As soon as the budget was pulled, closure rates tanked, sales fell off a cliff, and the business entered panic mode. Josh was staring down the gut-wrenching possibility of layoffs—because his team had optimized for cost per lead, not profit per customer.
Once we spoke, Josh realized the problem wasn’t the strategy—it was the metrics. He built a hierarchy of KPIs anchored to profitability, not departmental wins. That meant aligning marketing and sales around the LTV:CAC ratio—not just dropping CaC or juicing leads. Within 90 days, he not only added $1 million in revenue, but improved profit margins by 20%—enough to keep every job and even expand the team.
Josh’s story is a brutal reminder: optimizing for the wrong metric in isolation can silently kill your business. That’s why the LTV:CAC ratio is so powerful—it forces your team to zoom out and evaluate the full customer journey from acquisition to monetization.

As an American-made manufacturer, you've relentlessly optimized your production line, yet three hidden wastage points beyond your view still threaten your profitability and even your business survival.
Read MoreThe most profitable American-made DTC brands treat marketing like a production line—tracking six essential metrics that turn data into decisive action and profit.
Read MoreBreak Open the Black Box—Unlock the Power of Sales Attribution for American-Made DTC Brands.
Read More