
The most profitable American-made DTC brands treat marketing like a production line—tracking six essential metrics that turn data into decisive action and profit.
Read MoreDeciphering Data: The Impact of KPI Dashboards on Business Performance
Defining KPI Dashboards and Their Importance
Key Performance Indicators (KPIs) are the compass by which businesses navigate the vast ocean of data to reach their strategic goals. KPI dashboards serve as a centralized platform that aggregates, organizes, and presents these crucial metrics in an accessible and actionable format. By distilling complex data sets into clear visual representations, KPI dashboards empower decision-makers to monitor organizational health and make informed decisions swiftly. The importance of KPI dashboards lies in their ability to provide a real-time snapshot of performance against predefined targets, ensuring that businesses stay aligned with their objectives.
The Evolution of KPI Tracking in Business Intelligence
Over time, the practice of tracking KPIs has evolved significantly, thanks in part to advancements in business intelligence (BI) technology. From static reports and spreadsheets to dynamic, interactive dashboards, the tools used to track and analyze KPIs have become more sophisticated. This evolution has transformed the way organizations approach data analysis, moving from a reactive stance to a proactive strategy. Modern KPI dashboards not only highlight current performance but also offer predictive insights, enabling businesses to anticipate future trends and adjust their strategies accordingly. After reading this article you will understand more about the following.
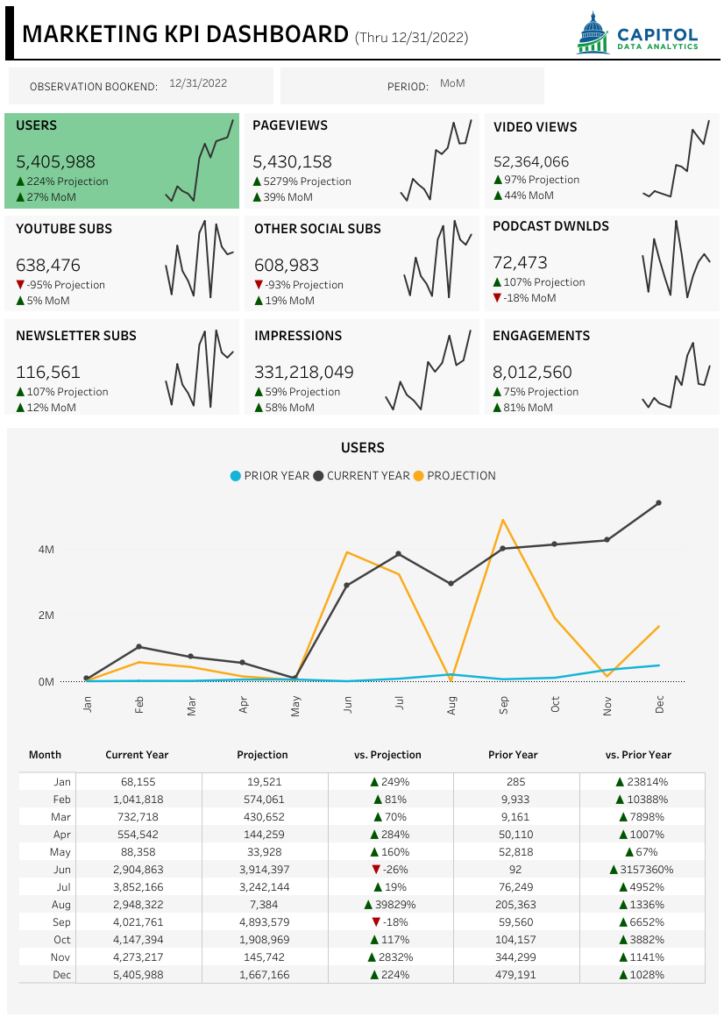
- Performance KPI Dashboard: A visual tool that displays key metrics for assessing organizational success.
- KPI Dashboard Tableau: Tableau’s platform offers robust features for creating interactive KPI dashboards.
- How to Create KPI Dashboards: The process involves selecting relevant KPIs, designing the layout, and integrating data sources.
Strategic Design Principles for KPI Dashboards
Creating an effective KPI dashboard requires a deep understanding of both the business’s strategic goals and the intricacies of design. A dashboard’s utility is defined by its ability to present KPI metrics in a way that is both comprehensible and actionable. To achieve this, the selection of KPI metrics must align with the company’s performance objectives, ensuring that each metric provides insights into business operations and outcomes.
Customization and Flexibility in Dashboard Design
Moreover, the visual design and user experience are paramount. A well-designed kpi metrics dashboard should be intuitive, allowing users to navigate and interpret data with ease. This involves:
- Employing a clean layout with bolded words for emphasis
- Choosing color schemes that differentiate data points without overwhelming the viewer
- Implementing graphs and charts that accurately represent data trends and patterns
Customization plays a critical role in the effectiveness of kpi dashboards. It’s essential to tailor these tools to various user roles within an organization, providing relevant data at a glance. Features like interactivity and drill-down capabilities allow users to explore data further, making kpi dashboards not just a reporting tool but an interactive platform for discovery and analysis.
Optimizing Business Performance with KPI Dashboards
On-time Data for Agile Decision-Making
KPI dashboards serve as a critical tool for enhancing business performance by providing on-time data that supports agile decision-making. The immediacy of data allows managers and executives to monitor the health of the business at a glance and react swiftly to market changes or internal issues. This agility is essential in maintaining a competitive edge, as it enables organizations to capitalize on opportunities and mitigate risks promptly.
Aligning Business Strategies with Data-Driven Insights
Moreover, KPI dashboards are instrumental in aligning business strategies with data-driven insights. By presenting key metrics that reflect the company’s strategic goals, these dashboards ensure that every department and team member is focused on the most impactful areas. This alignment fosters a unified approach to achieving business objectives, making it easier to track progress and adjust strategies as needed.
Enhancing Collaboration and Communication
Facilitating Team Discussions Around Data
Effective use of KPI dashboards goes beyond individual analysis; it also enhances collaboration and communication within teams. By providing a common data reference point, team members can engage in more productive discussions, making collective decisions based on shared insights. This collaborative environment encourages a culture of transparency and accountability, where data is the foundation of every conversation.
Sharing Insights Across Departments with Centralized Dashboards
Centralized KPI dashboards play a pivotal role in breaking down silos and promoting interdepartmental synergy. They allow for the sharing of insights across different departments, ensuring that everyone is on the same page regarding the company’s performance and goals. This cross-functional visibility is crucial for companies looking to foster a holistic approach to data-driven decision-making.
Technical Integration: Tableau and KPI Dashboards
The integration of KPI dashboards with Tableau represents a significant leap in the management of business analytics. Tableau’s robust platform enhances the utility of KPI dashboards by providing a suite of advanced features that streamline data analysis and visualization. This synergy facilitates the creation of dynamic and interactive KPI dashboards that can be tailored to meet the specific needs of any organization.
Using Tableau’s capabilities, businesses can transform raw data into meaningful KPI metrics dashboards that foster informed decision-making. The process of creating a KPI dashboard in Tableau involves:
- Integrating various data sources to achieve a unified view of performance metrics
- Utilizing Tableau’s data modeling features to build custom KPI metrics
- Applying visualizations that highlight dashboard KPIs effectively
Moreover, Tableau’s service enables users to share KPI performance dashboards across teams, ensuring that key insights are accessible to all stakeholders. This fosters a culture of data-driven decision-making that is crucial for maintaining a competitive edge in today’s fast-paced business environment.
Success Stories of KPI Dashboard Implementation
KPI dashboards have been instrumental in transforming data into actionable insights for businesses of all sizes. Small businesses have leveraged these tools to streamline their reporting processes, allowing them to focus on growth and performance improvements. By visualizing their kpi metrics, these smaller entities can quickly identify trends and adjust strategies in on-time, often with limited resources.
On the other hand, large enterprises have found that a well-implemented performance KPI dashboard can provide a significant competitive edge. With the ability to monitor KPIs and other industry-specific indicators, these corporations use KPI dashboards Tableau integrations to delve deeper into their vast data sets. The result is a comprehensive view of the company’s health, driving data-centric decision-making across various departments. KPI Tableau dashboard examples showcase how effectively visualizing and analyzing data can lead to better business outcomes. Read one of our full case studies below, where we implemented effective KPI dashboards to unlock value for XMD.
XstremeMD (XMD), a leading medical services provider, faced the challenge of manually generating internal encounter reports and external return on investment reports for customers. CDA took on the task of recreating XMD’s reports within the Tableau platform while incorporating best-in-class data visualizations for better analysis. To support the reporting infrastructure, an RDS database was utilized, providing a reliable and scalable solution for data storage and retrieval. Automation of reports that eliminated $6,000 worth of manual effort per year. The data being available on time allowed the staff to gain insights worth an additional $114,000 for the year.
FAQs: Navigating the World of KPI Dashboards
Clarifying Common Questions About KPI Dashboards
- What is a KPI dashboard? – A KPI dashboard is a visual representation tool that displays the most important metrics that help organizations track and analyze their performance against their strategic goals.
- How to create KPI dashboards? – Start by identifying the key metrics that align with your business objectives. Utilize tools like Tableau to create a dashboard that presents data in an accessible and actionable manner.
- What is a KPI in Tableau? – In Tableau, a KPI is a visual cue that informs the user about the progress towards a predefined target. Tableau allows users to create comprehensive KPI dashboards with interactive and on-time data visualizations.
- What are KPI dashboard best practices? – Ensure your KPI dashboards in Tableau are user-friendly, focus on relevant data, and include features like drill-downs for detailed analysis. Look at KPI Tableau dashboard examples for inspiration.
- How to maintain effective KPI dashboard performance? – Regularly review your KPI metrics to ensure they remain aligned with your business goals. Update your dashboards to reflect any changes in strategy or market conditions.
The Future of Data-Analytics for Business
As we look to the future, the role of KPI dashboards in shaping business strategy and operations cannot be overstated. The transformative impact of these tools has already been felt across industries, with dashboard KPIs providing a on-time pulse on company health. The next wave of business analytics promises even greater integration, with technologies like AI and machine learning enhancing the predictive power of KPI metrics.
Anticipating trends, the evolution of KPI dashboards will likely see a more profound use of dashboard KPIs in decision-making. The emergence of kpi dashboard Tableau integrations exemplifies this shift, where what is a KPI dashboard today may evolve into a fully automated decision engine tomorrow. As platform-specific metrics become more sophisticated, businesses will move from simply tracking performance to proactively shaping outcomes.
Ultimately, the future of data analytics lies in the ability to not only interpret vast amounts of data but also to act upon it swiftly and with confidence. Whether through kpi dashboards, Tableau, or other platforms, the goal remains the same: to empower businesses with the clarity and agility needed to thrive in an ever-changing market landscape.
The transformative power of KPI dashboards in business performance cannot be overstated. They provide on-time, data-driven insights that drive strategic decision-making, enhance collaboration, and, ultimately, optimize business performance. As we look ahead, the integration of advanced tools like Tableau will further streamline data analysis, making it even more accessible and impactful. The journey towards data-driven business operations may seem daunting, but with the right tools and strategies, it’s a journey well worth embarking on.
Related Articles We Think You Would Enjoy Next

Why Do American-Made Brands Keep Losing Money to Hidden Wastage?
As an American-made manufacturer, you've relentlessly optimized your production line, yet three hidden wastage points beyond your view still threaten your profitability and even your business survival.
Read More
Reporting Unleashed: Elevate Your Small Business with SMART Data Reporting
Reporting is often the most overlooked piece of data analytics. Reporting is the key cog in the data analytics.
Read Moreif your business relies on excel for reporting, check out our catalyst program and find out how it can be used to implement advanced reporting for your business.