Having a strategy is paramount to creating a data driven organization. A lack of data strategy is a major contributor poor returns on investment.
Read MoreMarketing Mix Model
Marketing is often seen as being more art than science. However, with the rise of digital marketing, science is becoming more involved. A powerful tool in the scientist’s toolbox is the Marketing Mix Model (MMM). MMM answers the question which activities are driving the business. This article will cover what MMM is, why MMM is useful, and the results of a MMM analysis.
What is a Marketing Mix Model (MMM)?
A MMM is a data-driven statistical analysis that quantifies the incremental impact of marketing and non-marketing activities on a KPI. Usually that KPI is sales, but it can also be other metrics like website visits. MMM’s are a technique that is being rediscovered in the attribution space due to the following reasons.
- Privacy Friendly: Unlike multi-touch attribution, MMM does not need user level data. MMM runs off aggregated data. This allows for easier implementation and less compliance issues.
- Holistic: MMM measures outcomes across all activities in one analysis. MMM accounts for online and offline activities and accounts for non-marketing activities such as trends, promotions and seasonality.
What can a Marketing Mix Model (MMM) be used for?
MMM is a tool that a skilled user can answer the following questions:
- What is the optimal level of spend for each marketing channel?
- Which marketing channel (TV, Google Ads, Direct Mail, Email) returns the maximum ROI?
- How would sales change if I made a change to my marketing plan?
- How much should I spend on marketing activities to increase my sales by X%?
What do the outputs look like from an MMM?
You can look at MMM as reverse engineering a recipe. You start with the end result sales and you use analysis techniques to assign the impact of the pieces that make up sales. Below you can see a picture that has the starting data on the left and the breakout of sales by marketing channel on the right. This is the simplest way to visualize what MMM results.

The analysis yields two types of results that can fuel business decisions. The first is descriptive output. Descriptive output is output that describes past performance. The first descriptive output you will see is waterfall contribution charts. These show the breakdown of activities based on the effect towards sales. This gives you an easy visual of what activities are driving sales.

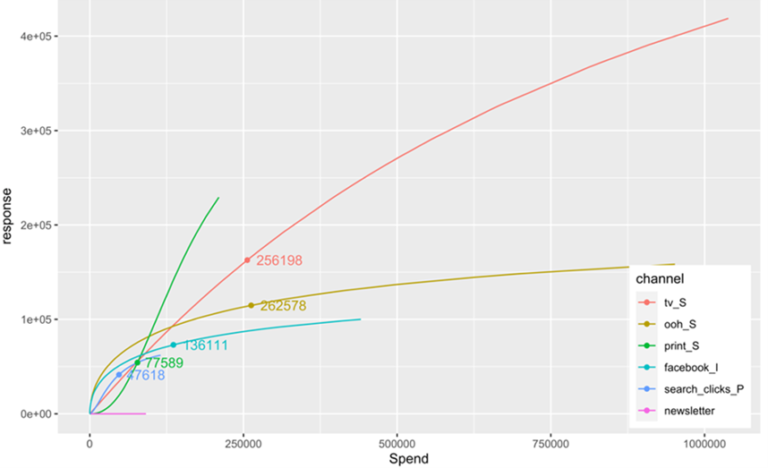
The second descriptive output that is useful is diminishing yield curves. If you looked at your marketing data and it told you that for every $1 you spent you would receive $2 in revenue. You should put as much money as possible into that system. However, marketing channels have a limited amount of potential customers and as you spend more these customers become more scarce. A diminishing yield curve shows how increased levels of spend in a marketing channel would affect the corresponding revenue returned.

The other type of output that is produced from MMM is predictive output. As the name suggests these outputs are used to make predictions on our KPI. The outputs produced from the MMM gives a data analyst the ability to answer questions like if I increased the spend in Google Ads, how would this affect my sales or how do I need to optimize my channel spend to maximize my sales. The accuracy of these predictions are tied to proper data collection and data availability.
Related Articles We Think You Would Enjoy Next
Decoding Your Customers’ Actions With Propensity Modeling
Propensity models are a group of statistical models that provide immense value to your organization.
Read MorePropensity Modeling Demystified: Predicting Customer Behavior for Growth (Video Series)
A three video series that explores propensity models.
Read MoreIf you are looking to answer the question of what activities are driving our sales. reach out to cda to implement an Mmm for your business.


