A three video series that explores propensity models.
Read MoreMaximize Marketing with Lookalike Modeling: Comprehensive Guide
What is Lookalike Modeling and How Does It Work?
Lookalike modeling is a marketing analytics technique that helps companies find potential customers who are similar to their existing customers. This is done by creating audience segments based on the attributes and behaviors of a seed audience, typically the company’s best customers. Using predictive modeling and mathematical algorithms, the modeling process identifies people who look and act just like the seed audience but may have not been identified by the company as potential customers. By targeting these lookalike audiences, companies can benefit from higher-performing, high-quality leads who are likely to convert.
In practical terms, lookalike modeling works by analyzing a company’s first-party data – such as purchase history, behavioral and demographic information – to create a model of its customer base. This model is then used to search for similar traits in third-party data sources to identify a new audience of potential customers who share characteristics with the existing customer base. By helping companies identify people most likely to convert and become valuable customers, lookalike modeling can help grow businesses and optimize conversion rates.
Understanding the Basics of Lookalike Modeling
Lookalike modeling is a powerful tool that can help you find new customers and grow your business. By analyzing the behavioral and demographic characteristics of your existing customers and audiences, lookalike modeling identifies prospects who closely resemble them. This process utilizes machine learning algorithms to create a new audience that shares similarities with your current customer base. One of the main benefits of lookalike modeling is the ability to target the right audience more effectively. If you are unable to identify potential customers or are looking to expand your reach, lookalike modeling can be used to generate audiences from the wider web who are most likely to convert.
By analyzing the existing customers and audiences you already have, you can gain valuable insights into what makes them unique. This information can then be used to identify audiences who exhibit similar traits and behaviors. The lookalike modeling process takes into account a wide range of factors, including purchasing history, browsing behavior, and more. By targeting audiences that look just like your best customers, you can improve the effectiveness of your marketing campaigns and drive better results.
Benefits of Using Lookalike Modeling
The main benefit of using models in marketing analytics is that they provide a data driven approach to coming to a conclusion rather than relying on intuition. Lookalike modeling is no different. These models use statistical methods to analyze and compare data from your existing customers, allowing brands to target audiences that have a high similarity to the seed audience parameters. By keeping your seed audience parameters narrow, lookalike modeling can identify the most accurate traits of your best customers. This approach offers big wins for brands by applying proprietary algorithms to generate audiences that you may have otherwise missed. The technology behind lookalike modeling takes the significant and most accurate traits of your best customers and creates new audiences at a similar level based on their similarity, optimizing marketing efforts and reaching potential customers more effectively.
Getting Started with Lookalike Modeling
Look-alike modeling is an established and well-proven strategy for brands looking to grow their business. By analyzing first and third party data, you can identify new potential customers who share similar behavioral and demographic profiles that match your target audience. This allows you to target users who act just like your target customers, generating big wins for brands looking to expand their reach.
In order to generate look-alike audiences, data is collected and analyzed at the individual level based on the similar attributes of your current customers. This data is then used by data management platforms to identify and target users who are most likely to be interested in your product or service based on their similar behavior and demographics.
What Data Is Valuable for Lookalike Modeling?
Garbage in, garbage out describes the modeling process. The most important piece to getting a good model is the data used to build the model. Here are five data sources to consider using to feed your lookalike model:
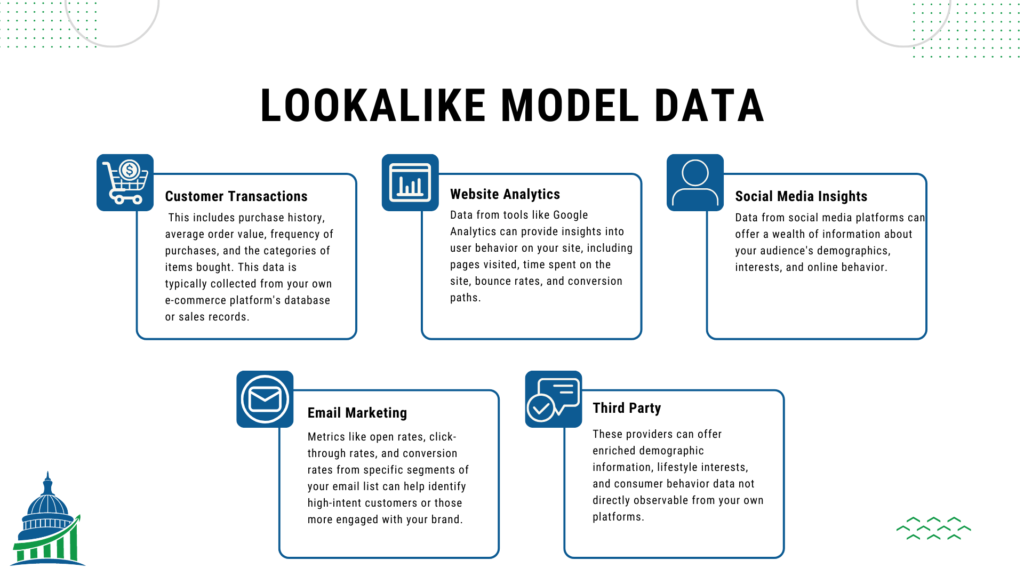
Customer Transaction Data: This includes purchase history, average order value, frequency of purchases, and the categories of items bought. This data is typically collected from your own e-commerce platform’s database or sales records. It’s foundational for understanding customer behavior and preferences.
Website Analytics Data: Data from tools like Google Analytics can provide insights into user behavior on your site, including pages visited, time spent on the site, bounce rates, and conversion paths. This information helps in understanding what attracts and engages your audience.
Social Media Insights: Data from social media platforms can offer a wealth of information about your audience’s demographics, interests, and online behavior. Platforms like Facebook, Instagram, and Twitter provide analytics tools for business accounts that can help identify trends and interests of your followers and those interacting with your content.
Email Marketing Data: If you engage in email marketing, insights from these campaigns can be extremely valuable. Metrics like open rates, click-through rates, and conversion rates from specific segments of your email list can help identify high-intent customers or those more engaged with your brand.
Third-party Data Sources: Depending on your jurisdiction and compliance with data protection regulations (like GDPR in Europe), purchasing data from or partnering with data providers can augment your dataset. These providers can offer enriched demographic information, lifestyle interests, and consumer behavior data not directly observable from your own platforms.
Why Do Marketers and Advertisers Need Lookalike Modeling?
By incorporating lookalike modeling into their marketing strategies, marketers and advertisers can improve the efficiency and effectiveness of their campaigns, ultimately leading to higher conversion rates and ROI. In the following sections you can see how marketers and advertisers use lookalike modeling in three key areas. The three areas are customer acquisition, cross-selling/upselling, and retention. In each section lookalike modeling’s role is described and a scenario is laid out that fits the section.
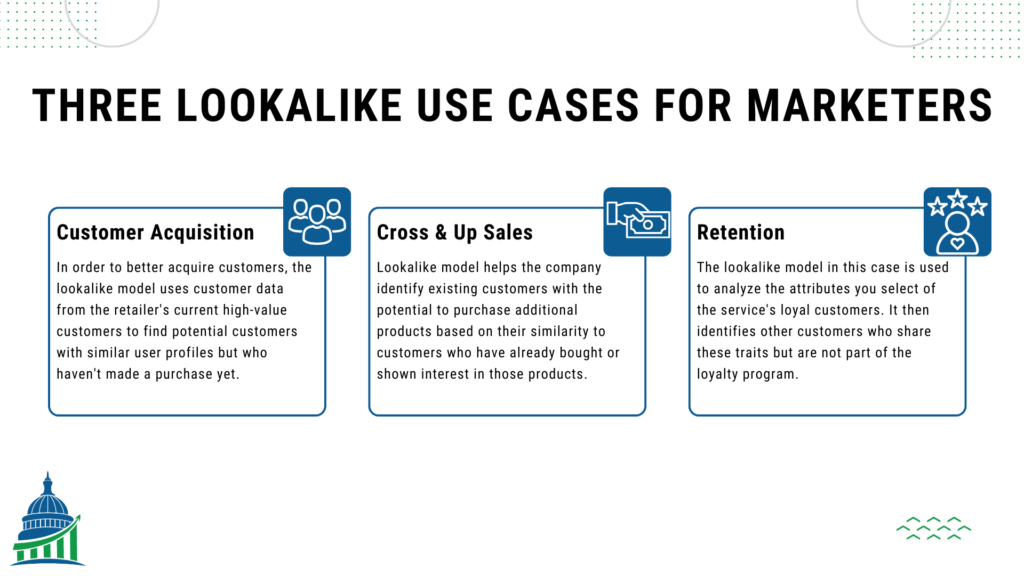
Utilizing Lookalike Modeling for Customer Acquisition
In order to better acquire customers, the lookalike model uses customer data from the retailer’s current high-value customers to find potential customers with similar user profiles but who haven’t made a purchase yet. This could include matching demographics, browsing behavior, and interests. By targeting these lookalike audiences with personalized ad campaigns, the retailer can increase the likelihood of converting prospects into new high-value customers.
Example: An online fashion retailer wants to expand its customer base. The retailer has a strong, loyal customer segment that frequently purchases high-end fashion items. By using lookalike modeling, the retailer aims to identify and target new prospects who share similar characteristics and behaviors with their high-value customer segment.
Enhancing Cross-Selling and Upselling
Here, the lookalike model helps the company identify existing customers with the potential to purchase additional products based on their similarity to customers who have already bought or shown interest in those products. By targeting these identified customers with tailored marketing messages that highlight the benefits of the time-tracking tool, the company can effectively cross-sell its products, thereby increasing customer value and revenue.
Example: A SaaS company offers a suite of productivity tools. They notice that customers who subscribe to their project management tool are more likely to benefit from their time-tracking tool as well. The company uses lookalike modeling to identify existing customers of the project management tool who are likely to be interested in the time-tracking tool but haven’t subscribed to it yet.
Optimizing Customer Retention and Loyalty Programs
The lookalike model in this case is used to analyze the attributes you select of the service’s loyal customers. It then identifies other customers who share these traits but are not part of the loyalty program. By understanding the factors that contribute to customer loyalty, the company can target these lookalike customers with personalized invitations to join the loyalty program, highlighting the benefits and rewards based on their shopping behavior and preferences. This approach not only helps in retaining customers but also encourages increased spending and engagement with the brand.
Example: A grocery delivery service has a loyalty program that rewards frequent shoppers with discounts and exclusive offers. To enhance their loyalty program’s effectiveness, the company uses lookalike modeling to identify customers who are similar to their most loyal customers but have not yet joined the loyalty program.
Lookalike Modeling Example: Big Bite Donuts Retail Location Research
In order to demonstrate the usefulness of lookalike modeling, I have created a fictional scenario that is a simplified version of what we at CDA have provided to our clients. Here is the setup to the example. Big Bite Donuts has 8 locations across the United States and is looking to add a ninth location. They know the markets they currently serve are the ideal markets for Big Bite Donuts locations. Ideally the ninth location would be in a market that looks like the other 8 locations. To solve this problem Big Bite Donuts reached out to CDA. The below sections breakdown the project and how CDA answered Big Bite’s questions.
How Does Lookalike Modeling Work, and How Do You Build a Lookalike Audience?
Lookalike modeling works by using the characteristics of a target group along with a statistical model to project which other groups have similar characteristics. The statistical model that was used in this case is a logistic regression, which creates a score for each group based on the how similar it is to the target group. In this example the target group is the 8 Zip3 locations that Big Bite is currently located in, and all the Zip3s across the continental US will be scored by the logistic regression to get a similarity score. For ease of use these scores will be grouped into 10 buckets where bucket 1 is most like our ideal location and bucket 10 is least like our ideal location.
What Do I Need to Get Started with Lookalike Modeling?
To get started, CDA collected Census data to use to characterize the Zip3s. The Census fields used were median household value, owner home owner percentage, median age, population, less than 9th grade education attained, 9th-12th grade education without diploma attained, high school education attained, some college attained, associates degree attained, bachelors degree attained, graduate degree attained, labor participation. Additionally, a Zip3 shapefile was found to create the map that can be found on the dashboard embedded below.
Big Bite Donuts Retail Location Research Solution
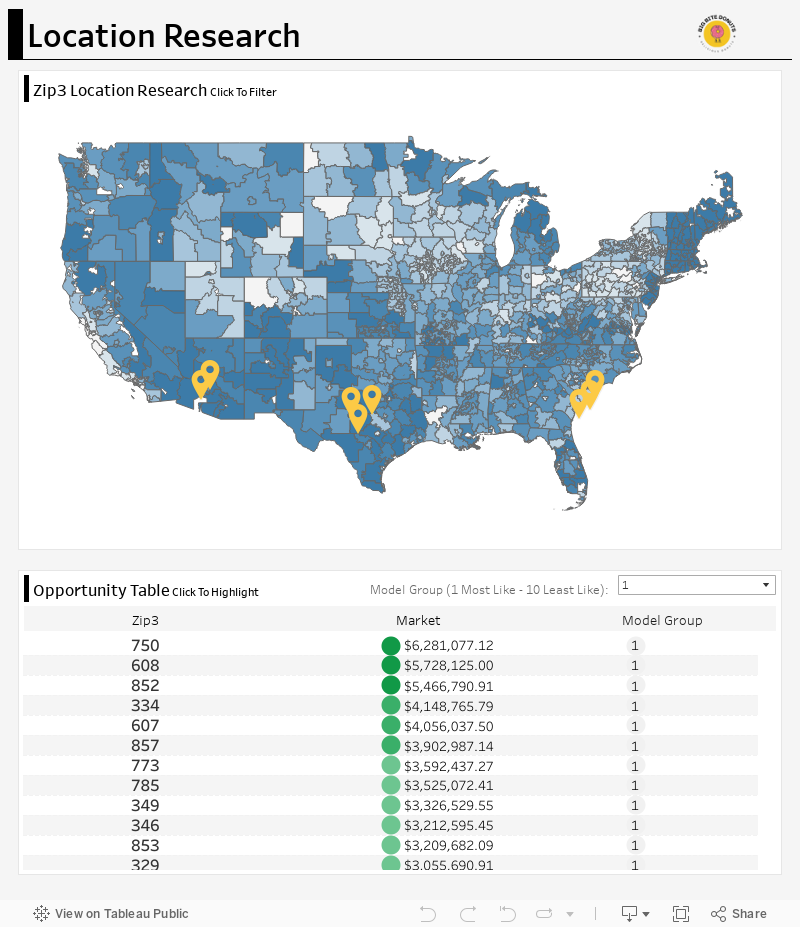
With the data collected, R was employed to aggregate the Census data by Zip3 and to create a logistic regression scoring algorithm. With the model created the entire continental US Zip3 shapefile was scored and grouped by its similarity to the ideal market Big Bite was looking for. This information was then put into a Tableau dashboard. Tableau allows for easy consumption of the data by Big Bite Donuts Executives. The dashboard is embedded below. Here are some key details about the dashboard:
- The map is colored with dark blue representing the most ideal locations and grey represents the least ideal locations.
- The yellow pins on the map represent current locations.
- The market number displayed is a calculation to address the total addressable market in the Zip3. Big Bite will want to consider both the similarity to their ideal market and the calculated addressable market for that specific location.
- To do this you could filter the opportunity table by Model Group 1 and look at the Zip3s ordered by addressable market.
- You can click Zip3(s) in the map to filter the table and click Zip3(s) in the table to highlight them on the map.
Related Articles We Think You Would Enjoy Next
Reporting Unleashed: Elevate Your Small Business with SMART Data Reporting
Reporting is often the most overlooked piece of data analytics. Reporting is the key cog in the data analytics.
Read More
Decoding Your Customers’ Actions With Propensity Modeling
Propensity models are a group of statistical models that provide immense value to your organization.
Read MoreNOT GETTING THE INSIGHTS YOU NEED? LEARN MORE ABOUT HOW THE CATALYST PROGRAM CAN TAKE THE GUESSWORK OUT OF REPORTING.