As an American-made manufacturer, you've relentlessly optimized your production line, yet three hidden wastage points beyond your view still threaten your profitability and even your business survival.
Read MoreYou’ve poured thousands into ads, influencers, and content, yet still feel like you’re stuck on a hamster wheel—chasing likes, clicks, and impressions that look great on a report, but don’t move the revenue needle. For American-made DTC brands, those “vanity metrics” aren’t just distractions; they’re budget black holes that starve the tactics driving real customer growth.
In this article, you’ll learn how to cut through the noise and focus only on the handful of metrics that tie directly to your bottom line. We’ll show you a simple two-question framework for choosing the right KPIs, three fast ways to set meaningful targets, and how to wire it all into live dashboards that keep your whole team aligned and accountable. By the end, you’ll have a clear roadmap to turn data into dollars—no more guesswork, only results.
It’s easy to fall in love with big numbers—100,000 Instagram likes, a sudden spike in website visits, or a massive follower-count milestone. These “vanity metrics” are seductive: they’re visible, immediately gratifying, and make for impressive headlines in quarterly reports. But when decision-makers fixate on these superficial indicators, they risk making decisions with ego rather than based on measurable outcomes.
Often leaders justify spending based on these vanity metrics, because they are easy to collect, look impressive, and is “what we have always done”. The reality is that when marketing leaders direct budgets toward channels that maximize likes or impressions, they risk starving the tactics that actually move the needle on the metrics that matter. For example, a skincare brand might dump resources into an Instagram influencer program that boosts likes by 200%, only to discover that TikTok ads, which generated half as many impressions, deliver three times the click-to-purchase rate and better audience quality.
If you are chasing vanity metrics you probably notice these three symptoms:
Consistently Poor Return on Investment: Perhaps the most significant symptom of vanity metric-driven spending is persistently disappointing ROI. When marketing dollars chase metrics that don’t correlate with business growth, the inevitable result is wasted resources. Marketers themselves estimate they waste approximately 26% of their marketing budget (Source).
Continually Asking For Insights: A clear warning sign that vanity metrics are dictating your marketing spend is when you look at your marketing reports, but keep going back to the team asking for deeper ‘insights’. These reports typically showcase impressive numbers about social media likes, followers gained, impressions, and website hits, but contain little to no information on leads, conversions, or revenue.
Misalignment Between Marketing Activities and Business Objectives: When vanity metrics drive budget allocation, marketing efforts gradually drift away from core business goals. This symptom manifests as a growing disconnect between what marketing is measuring and what the business actually needs to achieve.
Ultimately, the most powerful metrics are those that speak directly to your bottom line. By weeding out vanity metrics and establishing a clear hierarchy of true KPIs, American-made brands can reclaim wasted budget and refocus marketing effort. The next section details a process of selecting the important metrics for an initiative.
When your team launches a new campaign or initiative, it’s all too easy to default to the same old metrics—clicks, impressions, followers—out of habit. To break free of this cycle and zero in on truly actionable data, start every project by asking two deceptively simple questions:
These questions force you to articulate the real business outcome you’re chasing how the initiative will deliver on that outcome. Before we break down these questions and provide examples, keep these three things in mind.
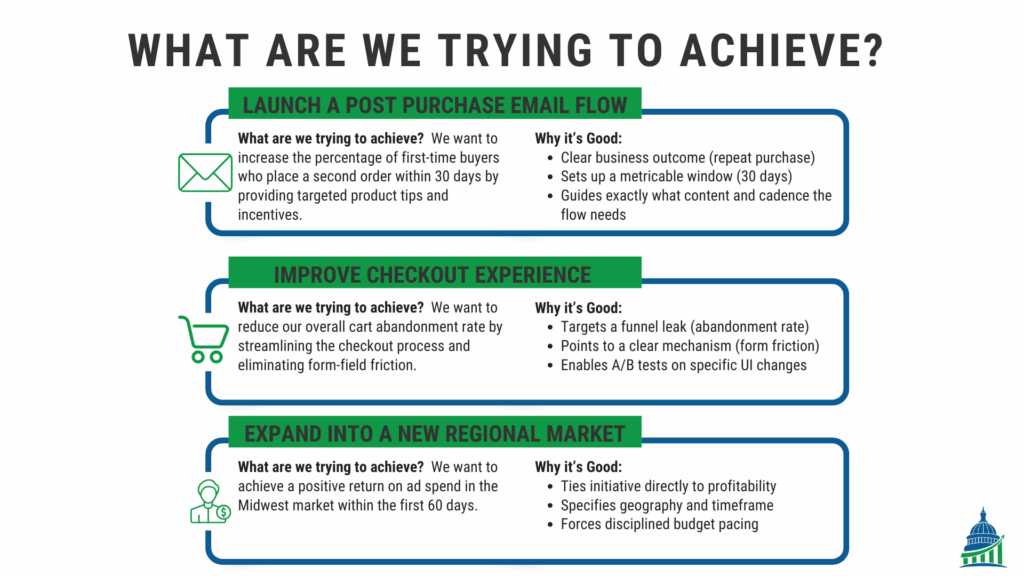
What are we trying to achieve? (Defines the business Outcome): Your response here should be a concise, 1–2 sentence statement of the business-relevant outcome your project exists to deliver—no metrics, no KPIs, just clear purpose:
“We want to increase the average order value among new customer cohorts by encouraging higher-tier bundle purchases.”
Why this matters:
Here are three concrete examples of how to answer “What are we trying to achieve?”, each tied to a real initiative, with an explanation of why it’s a strong, actionable response:
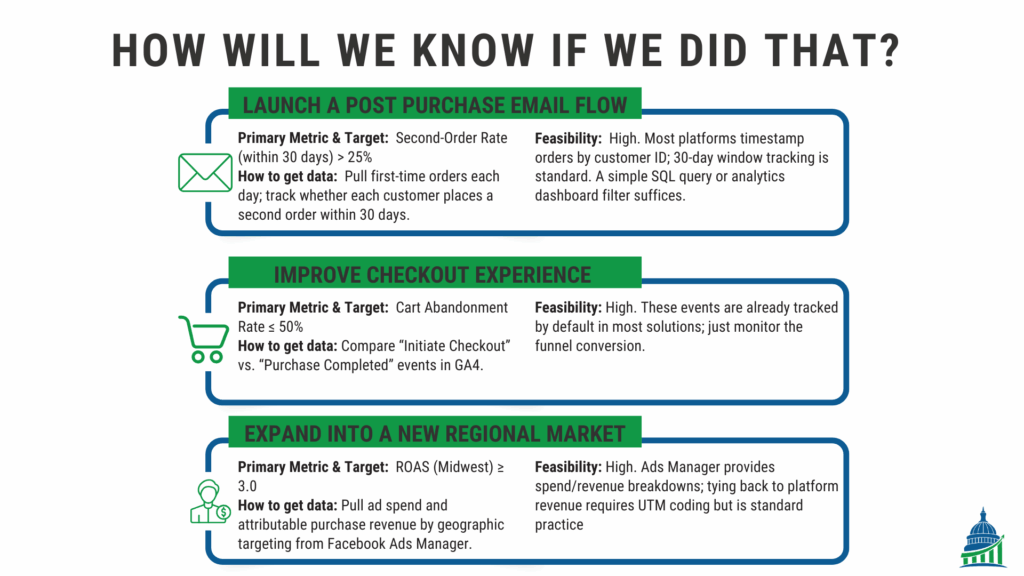
How will we know if we did that? (Nail Down the Success Criteria): Now translate your answer to question one into specific metrics and targets. This step reveals whether your goal is measurable, and where you’ll draw the line between “good” and “great.” For the example above, you might commit to:
Why this matters:
Here are the three previous examples with the answers to this question, how that data may be collected, and how feasible that collection would be.
It might take some practice but by completing this simple exercise, you’ll steer every initiative toward high-impact metrics, rather than the shallow numbers that feel good but don’t move the needle. This simple act will make you finally feel like you are getting the value out of your marketing initiatives that were promised but always left you feeling longing for more.
One thing you might still be asking yourself is “How did you build that target number?” You are in luck; the next section breaks down the three strategies for developing a reasonable target number.
Tracking metrics is only half the battle; without a clear target, even the most insightful data can leave your team spinning its wheels. “Our conversion rate is 2.3%.”, “Our average order value is $85.”…tell you nothing actionable. These two examples illustrate why you need a target to tell you if that number is good, bad, or otherwise.
Additionally, targets must be set at the planning stage. The moment you define your outcome (“What are we trying to achieve?”), immediately follow up with “By how much?” This ensures every tactic, from creative briefs to channel budgets, is aligned to the same finish line. Waiting until mid-campaign or post-launch to set targets invites you to move the goal posts and have a lack of clarity on the project’s success. With this in mind let’s get to how you actually build your targets.
Back-of-Napkin Estimate (Quick & Dirty)
What it is: A rapid target built from past performance, intuition, or industry benchmarks.
How to do it:
Why it works: It’s fast—and even a rough target rooted in reality is superior to no target at all.
Use it when: You need a ballpark KPI in minutes to unblock decision-making.
Avoid it when: The initiative carries high risk or big budget swings—errors here are costly.
Example: Last year’s Black Friday conversion rate was 4.2%. With bigger promos and more ad spend this year, you might set a 4.5–5% target.
Bracketing (Logical Process of Elimination)
What it is: A team exercise to define an unacceptable low, a ridiculously high, and then refine toward a realistic target and a stretch goal.
How to do it:
Why it works: Bracketing builds team alignment on what’s realistic versus aspirational before you spend a single dollar.
Use it when: You want to bind stakeholders to a shared frame of reference.
Avoid it when: You lack domain expertise on the team—guesses will be wild.
Example: A startup discovers $5 CAC is impossible and $500 CAC is ruinous. Through bracketing, they settle on $80 as the target and $60 as a stretch.
Pick a Number & Adjust Later (When No Data Exists)
What it is: A starting KPI for brand-new programs—then refine it once you have real-world data.
How to do it:
Why it works: Even a “wrong” KPI focuses your team on measurement—and you’ll quickly learn to adjust.
Use it when: You’re testing a completely new channel or offer with zero prior benchmarks.
Avoid it when: You can easily do one of the other two options. This should be a last resort.
Example: A new DTC skincare brand sets a 2% conversion-rate target for its first ad spend. After three months at 2.8%, they bump the KPI to 3% as the new stretch goal.
In short, numbers alone won’t move the needle—you need clear targets from day one to turn raw metrics into actionable truth. By defining your “how much” at the planning stage and choosing one of our three fast-to-implement approaches (napkin estimates, team-based bracketing, or pick-and-adjust), you give every campaign a measurable finish line and prevent mid-flight goal-post shifts.
With targets locked in, the next step is to wire those KPIs into dashboards—so you can monitor performance at a glance, spot deviations instantly, and keep your whole team aligned on hitting your goals. Let’s dive into how to build dashboards that operationalize your KPIs and drive consistent execution.
A well-designed dashboard is the command center of marketing, giving you insights into where your initiatives are and if you are on track to meeting the targets you took the time to build. When used correctly, dashboards provide three main benefits when it comes to performance management:
Example 1: Big City Properties Tableau Health Report
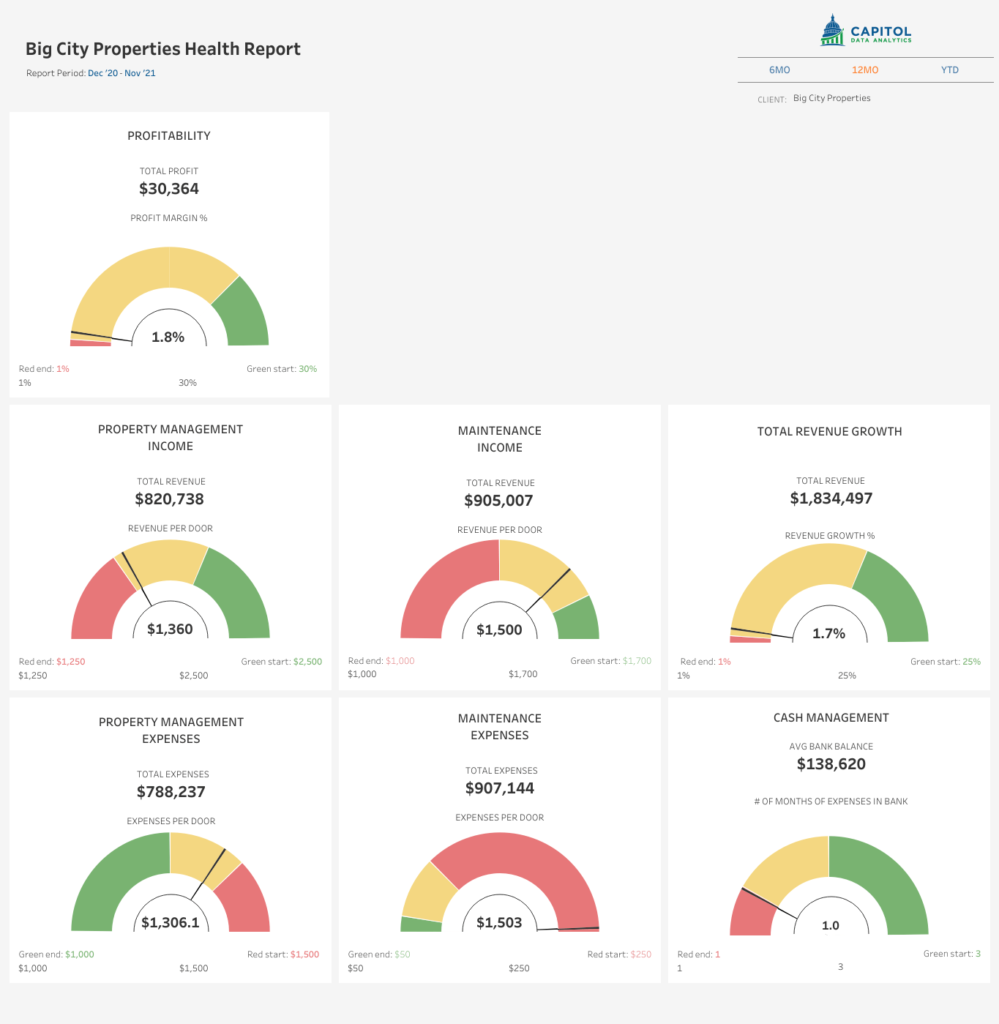
The “Health Report” tableau dashboard for Big City Properties nails performance management by turning complex financials into a series of intuitive, goal-driven visualizations:
Why It Works: By combining normalized KPIs, clear thresholding, and segmented financial perspectives—all wrapped in an interactive, time-aware layout—this dashboard transforms raw accounting data into a real-time health check. Operations, finance, and executive teams can all rally around the same visuals and agree on next steps.
Example 2: Marketing KPI Tableau Dashboard
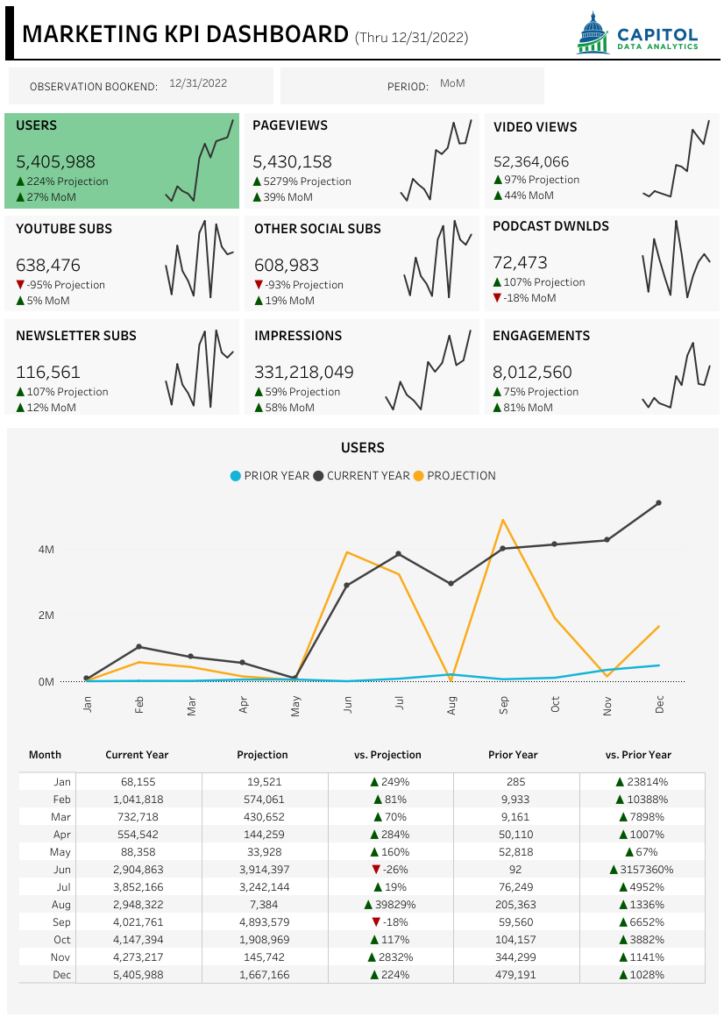
The Marketing KPI Dashboard from Capitol Data Analytics exemplifies performance management for a digital marketing operation:
Why It Works: By layering real-time KPIs, forecast comparisons, channel breakdowns, and detailed trend analytics—all in a single, navigable canvas—this dashboard empowers marketing leaders and analysts to monitor performance, validate hypotheses, and pivot strategies mid-campaign. It balances high-level clarity with deep insight, making it a powerful tool for data-driven growth.
Likes and pageviews might fill up your dashboards, but they won’t pay the bills. True marketing mastery comes when you ruthlessly weed out vanity metrics and zero in on KPIs that correlate with customer acquisition, average order value, and lifetime revenue. That shift transforms guesswork into precision and wasted spend into growth. If you apply the frameworks shown in this article you will be well on your way to killing vanity metrics.
If the advice from this article didn’t give you the answer you need to win the war against your competition, then click here to schedule a free call with us. We’d be honored to assist you with some customized, free guidance so you can continue to serve the communities you support so well.
Oh, and if you have this and found it the article you needed to read, please share it with another American Made owner.
As an American-made manufacturer, you've relentlessly optimized your production line, yet three hidden wastage points beyond your view still threaten your profitability and even your business survival.
Read MoreBreak Open the Black Box—Unlock the Power of Sales Attribution for American-Made DTC Brands.
Read MoreThe most profitable American-made DTC brands treat marketing like a production line—tracking six essential metrics that turn data into decisive action and profit.
Read MoreNEED MORE ANSWERS ON HOW TO WIN THE WAR AGAINST CHEAP CHINESE CRAP? WE’D BE HONORED TO PROVIDE SOME CUSTOMIZED FREE GUIDANCE.