Break Open the Black Box—Unlock the Power of Sales Attribution for American-Made DTC Brands.
Read MoreProfitable marketing for American-Made direct to consumer companies can be difficult to attain. For example, between 2018 and 2020, advertising costs on Facebook and Instagram more than doubled (Source). As competition intensifies, it can seem like your marketing budget yields less and less customers, eroding profit margins. This article will give you options to recover your profit margin that don’t include blowing out your marketing budget.
Imagine unlocking hidden profit streams that no amount of extra ad spend can buy. By mastering the three profit pillars—raising your prices without chasing away buyers, igniting buy-again behavior, and slashing your cost to acquire each customer—you’ll break free from the marketing treadmill. Below, we strip away the fluff and give you the exact framework to erect these pillars under your business for explosive profit growth.
Before you start moving prices you need to understand if your business is in a commodity or value-based market. A commodity market is one where the lowest priced product wins, because the items are largely the same. For instance, light bulbs, trash bags, etc. are mostly purchased based on price. A value-based market is one where perceived value such as brand value and differentiators allow companies to charge more for a product. Think Rolex, at the end of the day it tells time, but the brand value and quality materials allow for a much higher price than other watches.
If your business exists in a value-based market these pricing strategies will work for you. If you are in a commodity driven market you should skip to the next section. The basic strategy here is raise your prices until the loss of purchases outweighs the gains in increased profit. This may sound difficult, but let’s break this down into tactical steps and examples.
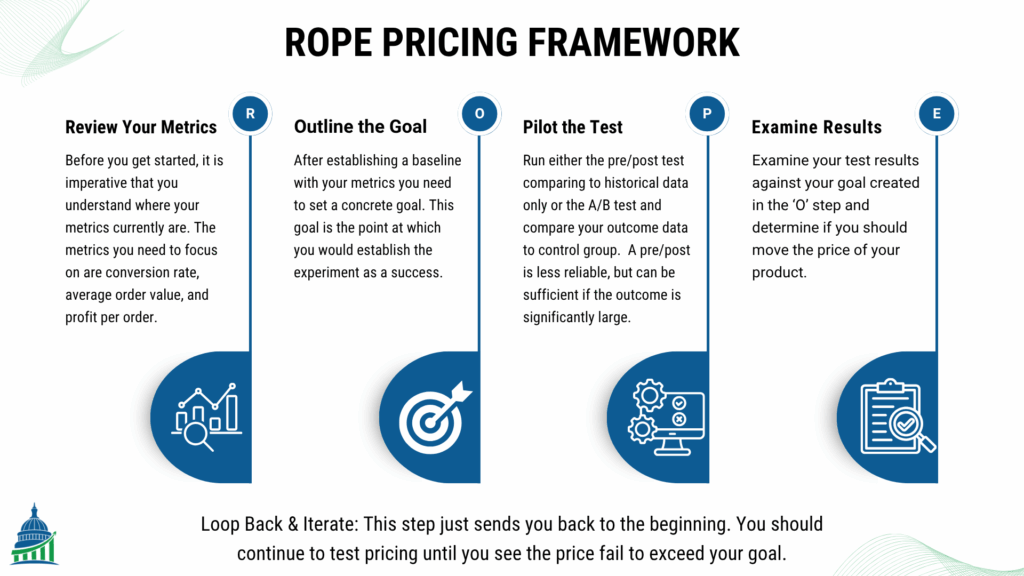
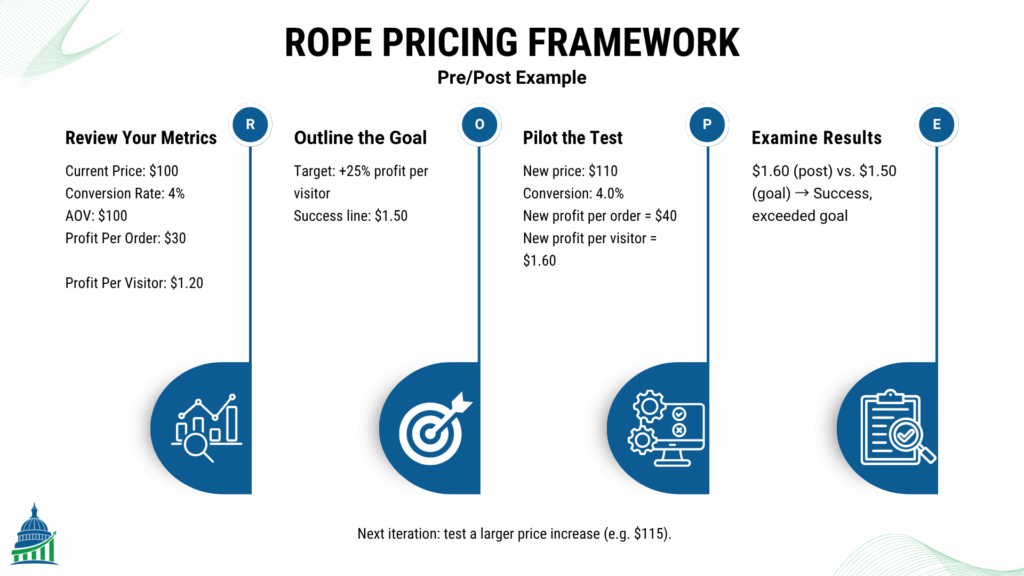
Review Your Metrics: Before you get started, it is imperative that you understand where your metrics currently are. The metrics you need to focus on are conversion rate, average order value, and profit per order.
Outline the Goal: After establishing a baseline with your metrics you need to set a concrete goal. This goal is the point at which you would establish the experiment as a success. You want to do this step before you run the test, because you want to definitively be able to answer if the test was a success. This will likely involve back of the napkin math to write out the numbers and determine what success looks like.
Pilot the Test: There are two ways you can run a test. The first is a pre/post test. This just means change the price, see what happens and compare it to your goal. This type of test is less reliable, but in most cases can give you a good enough answer. The second type of test is an A/B test which splits traffic between the original price and the new price and measures what happens.
Examine Results: Based on which test you chose you will examine the results differently. For the pre/post test you compare the results to your goal and see if the new price exceeded your success line. If you ran an A/B test you compare the two price’s metrics directly. If the difference in performance achieved your desired goal then you accept the new price.
Loop Back & Iterate: This step just sends you back to the beginning. You should continue to test pricing until you see the price fail to exceed your goal.
Example 1: Pre/Post Test
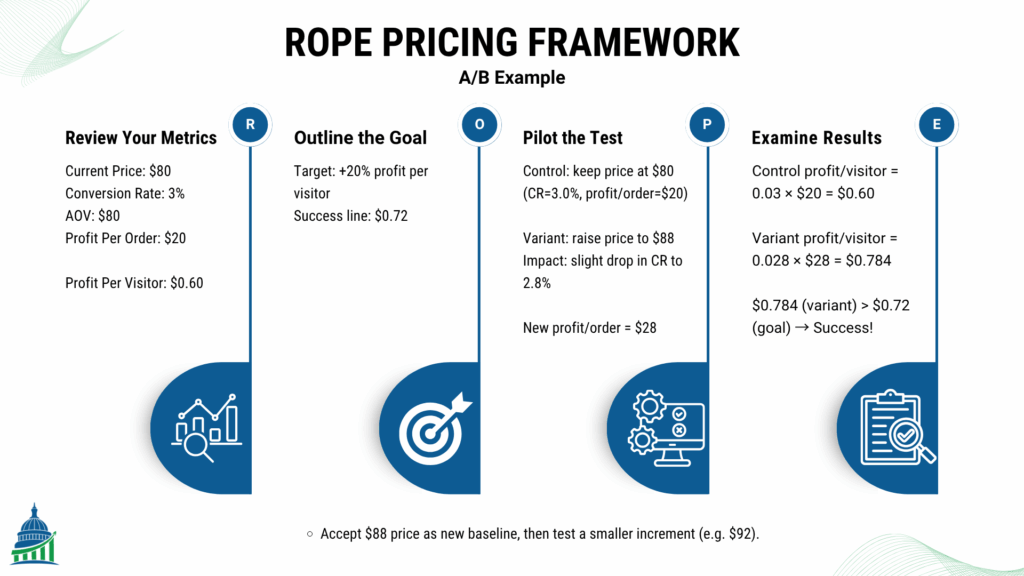
Accept $88 price as new baseline, then test a smaller increment (e.g. $92).
Raising prices doesn’t have to send your sales into free-fall—you just need a systematic approach. By applying the ROPE framework to read your metrics, outline a goal, pilot a test, examine results, and iterate, you’ll find the sweet spot where every price bump adds more to your bottom line than it costs in lost orders. Over time, these small, data-driven adjustments compound into outsized profit gains—without ever alienating the customers who value what only your American-made brand can deliver.
To drive sustainable growth, DTC brands must stop chasing every lead and start focusing on the buyers who deliver the highest lifetime value. By zeroing in on your ideal customer profile, harnessing the power of referrals, leveraging platform algorithms, and—if you’re ready—deploying predictive analytics, you can fill your funnel with the people most likely to spend more, stay loyal, and advocate for your brand. Below are four strategies, from easiest to most advanced, with clear pros and cons for each.
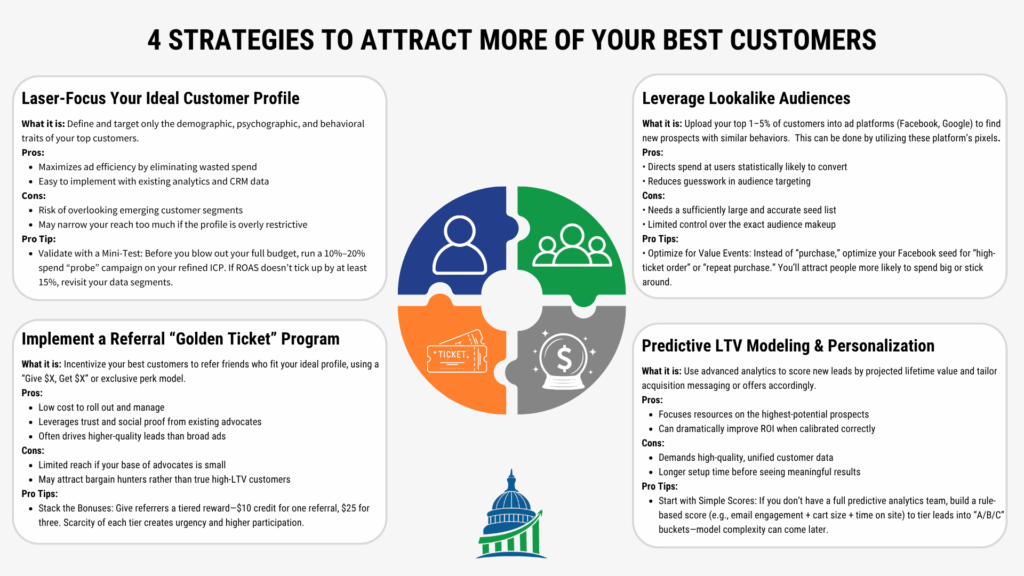
Laser-Focus Your Ideal Customer Profile
What it is: Define and target only the demographic, psychographic, and behavioral traits of your top customers.
Pros:
Cons:
Pro Tips:
Example: A premium candle brand analyzes its top 10% of buyers and discovers they’re predominantly urban professionals aged 30–45, then adjusts its ad targeting accordingly.
Implement a Referral “Golden Ticket” Program
What it is: Incentivize your best customers to refer friends who fit your ideal profile, using a “Give $X, Get $X” or exclusive perk model.
Pros:
Cons:
Pro Tips:
Example: A skincare DTC brand offers $10 credit to both referrer and referee, generating a 15% boost in new customers who match the top-spending cohort.
Leverage Lookalike Audiences
What it is: Upload your top 1–5% of customers into ad platforms (Facebook, Google) to find new prospects with similar behaviors. This can be done by utilizing these platform’s pixels.
Pros:
Cons:
Pro Tips:
Example: An athletic apparel brand feeds Facebook its highest-LTV customers and sees a 30% lift in ROAS on the resulting lookalike campaign.
Predictive LTV Modeling & Personalization
What it is: Use advanced analytics to score new leads by projected lifetime value and tailor acquisition messaging or offers accordingly.
Pros:
Cons:
Pro Tips:
Example: A subscription service builds a predictive model using purchase history and engagement metrics, then offers premium trial bundles only to leads with an LTV score above a set threshold—resulting in a 40% increase in subscription retention.
Lowering your customer acquisition cost isn’t about penny-pinching—it’s about doubling down on the ad elements and channels that actually convert, while swiftly cutting what doesn’t. Below are two strategies—complete with pro tips—that let you continuously optimize your funnel and shift budget toward the highest-return tactics.
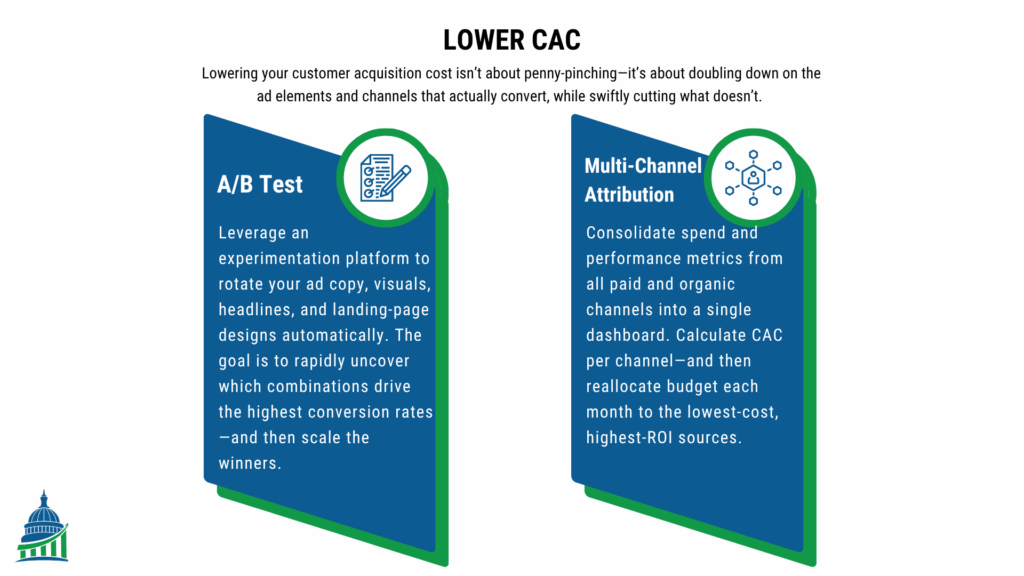
Automate & A/B Test Creatives and Landing Pages
Overview: Leverage an experimentation platform to rotate your ad copy, visuals, headlines, and landing-page designs automatically. The goal is to rapidly uncover which combinations drive the highest conversion rates—and then scale the winners.
Pros:
Cons:
Pro Tips:
Optimize Channels with Multi-Channel Attribution Analysis
Overview: Consolidate spend and performance metrics from all paid and organic channels into a single dashboard. Calculate CAC per channel—and then reallocate budget each month to the lowest-cost, highest-ROI sources. Click here for a deep dive article on this topic.
Pros:
Cons:
Pro Tips:
By automating your creative experiments and ruthlessly reallocating budget toward top-performing channels—guided by these pro tips—you’ll systematically drive down your CAC, amplify ROI, and ensure every marketing dollar works harder for your DTC brand.
As you’ve seen, true profit growth doesn’t come from simply pouring more dollars into advertising—it comes from mastering the three profit pillars. First, you learned how to raise prices without alienating your buyers by using the ROPE framework: benchmarking your baseline metrics, setting a clear success goal, piloting controlled tests, and iterating until you hit your sweet spot. Next, we covered tactics to drive more purchases by attracting your highest-value customers. You do this through precise targeting, referrals, lookalike modeling and predictive LTV models. Finally, we tackled how to slash your CAC by automating creative and landing-page experiments and reallocating spend to the lowest-cost, highest-performing channels.
Taken together, these strategies form a cohesive playbook for sustainable, data-driven growth. You’ll no longer rely on gut instincts or ever-rising ad spend; instead, you’ll have repeatable frameworks that boost margins, deepen customer relationships, and optimize every dollar you invest in marketing. Now it’s your turn: pick one pillar to implement this week and watch your profit engine fire up—no bloated budget required.
If the advice from this article didn’t give you the answer you need to win the war against your competition, then click here to schedule a free call with us. We’d be honored to assist you with some customized, free guidance so you can continue to serve the communities you support so well.
Oh, and if you have this and found it the article you needed to read, please share it with another American Made owner.
Break Open the Black Box—Unlock the Power of Sales Attribution for American-Made DTC Brands.
Read MorePropensity models are a group of statistical models that provide immense value to your organization.
Read MoreAs an American-made manufacturer, you've relentlessly optimized your production line, yet three hidden wastage points beyond your view still threaten your profitability and even your business survival.
Read MoreNEED MORE ANSWERS ON HOW TO WIN THE WAR AGAINST CHEAP CHINESE CRAP? WE’D BE HONORED TO PROVIDE SOME CUSTOMIZED FREE GUIDANCE.