Break Open the Black Box—Unlock the Power of Sales Attribution for American-Made DTC Brands.
Read MoreSmall Business KPI Dashboards: Essential Metrics for Growth
The Importance of KPIs for Small Businesses
For small businesses, Key Performance Indicators (KPIs) are not just numbers to track; they are vital signs that indicate the health and direction of the company. Integrating KPIs into the business strategy offers a clear view of performance and paves the way for informed decision-making. By setting and monitoring the right KPIs, small businesses can focus their efforts, optimize their resources, and drive growth. The transformative power of KPIs is evident in numerous case studies where small businesses have leveraged these metrics to pivot strategies, enhance operations, and ultimately achieve substantial growth. A well-structured small business KPI dashboard becomes the central hub for this strategic journey, turning data into actionable insights.
Designing an Effective Small Business KPI Dashboard
Creating a small business KPI dashboard is a strategic process that begins with a clear understanding of your company’s unique goals and objectives. It’s essential to identify which key performance indicators (KPIs) will serve as reliable signposts on your business’s journey towards those goals. The selection of KPIs should be intentional, focusing on those that truly measure progress and performance.
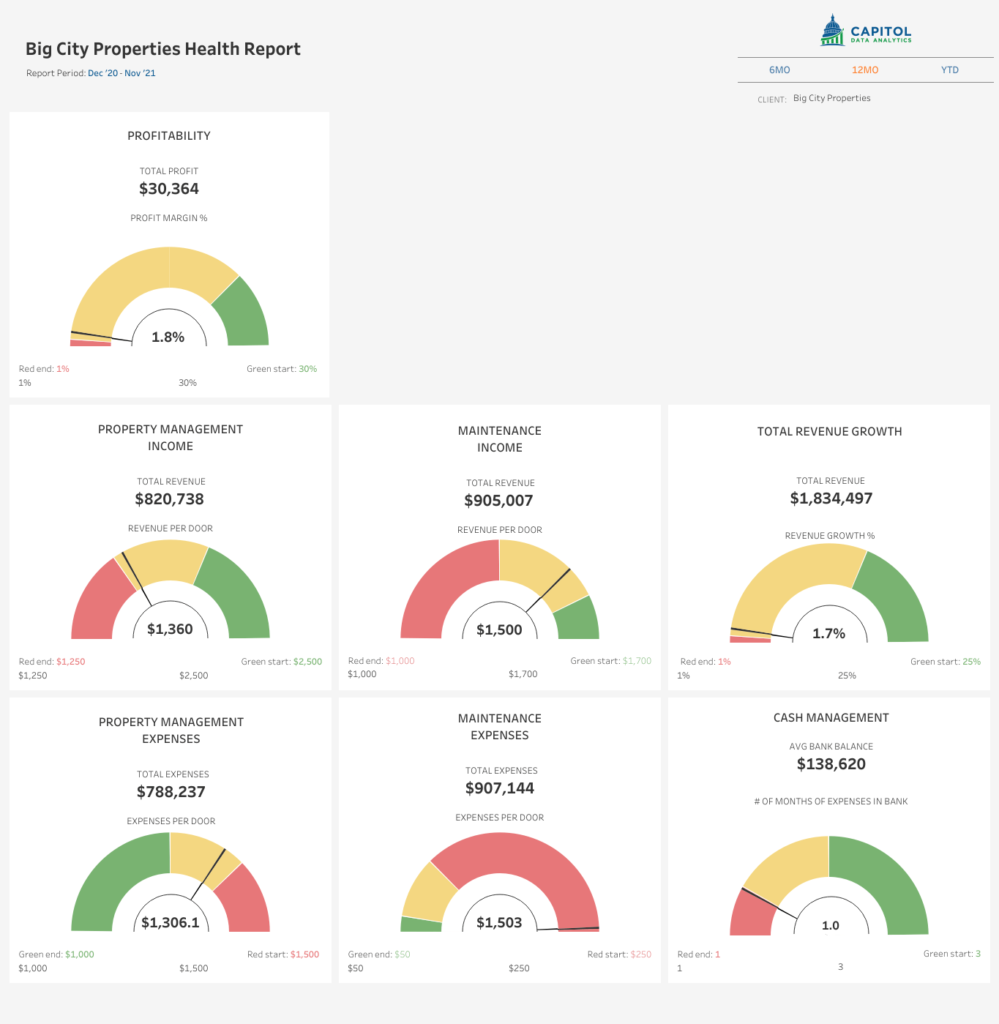
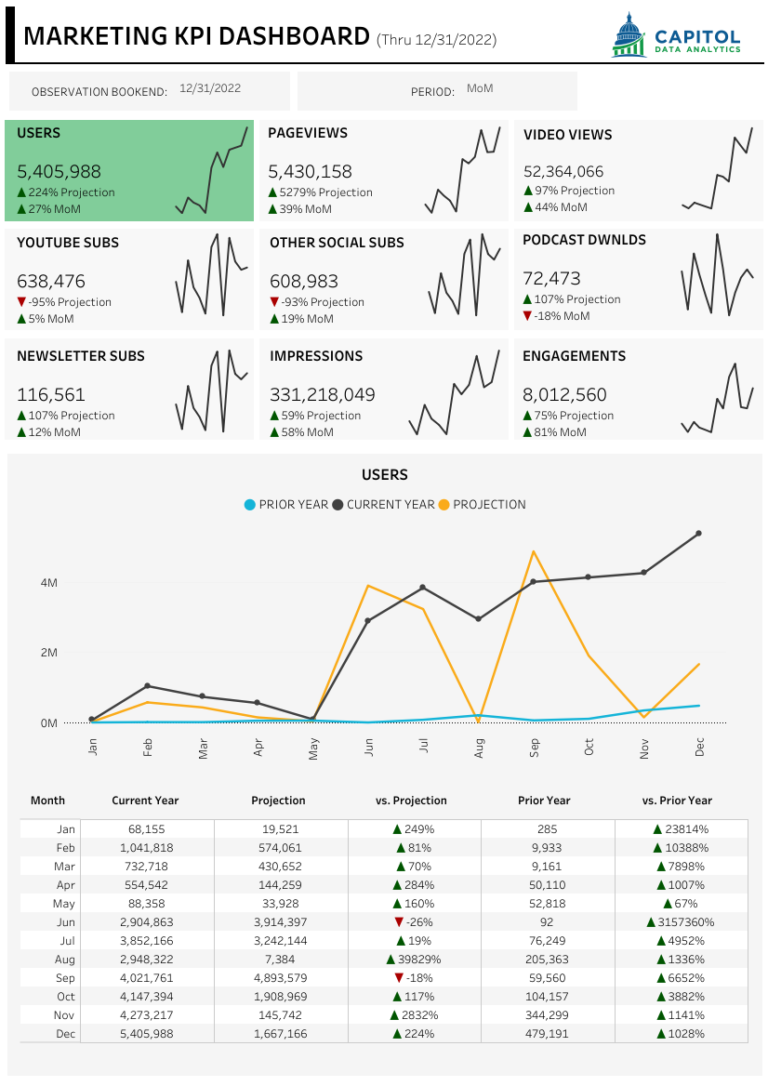
Once the KPIs are selected, integrating various data sources is crucial for a comprehensive view. This integration ensures that the dashboard reflects a full spectrum of business operations, from sales and marketing to customer service and inventory management. A well-designed business KPI dashboard not only tracks performance but also empowers decision-makers with actionable insights. Below are two examples of KPI dashboards CDA has created.


Key Metrics to Include in Your Small Business Dashboard
When it comes to monitoring the health and progress of your small business, certain metrics are indispensable. A well-constructed small business KPI dashboard should provide a snapshot of your company’s vital signs, enabling quick and informed decision-making. Here are some of the critical metrics to consider:
- Financial Metrics: Key financial figures such as revenue, profit margins, and cash flow offer insights into the financial stability and profitability of your business.
- Customer Metrics: Understanding your customer base is crucial. Metrics like acquisition costs, retention rates, and satisfaction levels help in evaluating marketing strategies and customer service effectiveness.
- Operational Metrics: To gauge the efficiency of your operations, track ratios such as efficiency ratios, inventory turnover, and delivery times. These can highlight areas for improvement in your supply chain and operational processes.
By integrating these metrics into a business dashboard, you can create a powerful tool for steering your company towards growth. A dashboard for business not only serves as a central point for monitoring performance but also acts as a communication tool, aligning team efforts with business objectives. Remember, a business KPI dashboard is more than just a display of numbers; it’s a reflection of your company’s operational heartbeat.
Best Practices for Dashboard Management and Analysis
Regularly Updating and Maintaining Your Dashboard
For a small business KPI dashboard to be effective, it must reflect the most current data. Regular updates ensure that the information displayed is relevant and can be relied upon for making informed decisions. Maintenance is equally critical to prevent data discrepancies that could lead to strategic missteps. A well-maintained dashboard serves as a reliable foundation for performance analysis and business growth.
Training Your Team on Dashboard Insights
Empowering your team with the knowledge to interpret business dashboard data is vital for collective success. Training sessions can help staff understand the significance of various metrics and how they relate to their specific roles. When team members are adept at reading and acting on the dashboard for business insights, the company can respond swiftly to market changes and internal performance fluctuations.
Leveraging Data for Strategic Planning
Integrating KPI business dashboards into strategic planning can provide a competitive edge. The insights gained from a business KPI dashboard should inform forecasting, goal setting, and resource allocation. By analyzing trends and patterns, small businesses can anticipate future challenges and opportunities, positioning themselves for sustainable growth and success.
How to Select KPIs for Small Businesses?
Selecting the right Key Performance Indicators (KPIs) is crucial for small businesses aiming to track and improve their performance. The criteria for choosing the most relevant KPIs should align with the company’s strategic goals and provide actionable insights. It’s important to strike a balance between leading indicators, which can predict future performance, and lagging indicators, which present a historical view of outcomes.
As businesses grow and markets evolve, the KPIs may need to be adapted. It’s not just about setting them once and forgetting; it’s about continuously refining your small business KPI dashboard to reflect the changing dynamics of your business environment. Here are some points to consider:
- Relevance: Ensure each KPI is directly linked to specific business objectives.
- Balance: Include a mix of financial, customer, and operational metrics to get a well-rounded view of business health.
- Adaptability: Periodically review KPIs to ensure they remain aligned with business goals and make adjustments as necessary.
Ultimately, the KPIs chosen should empower small businesses to make informed decisions and drive growth. Whether it’s through a business dashboard, a company dashboard, or a specialized dashboard for business, the goal is to create a business KPI dashboard that is both informative and adaptable.
Using Tableau’s capabilities, businesses can transform raw data into meaningful KPI metrics dashboards that foster informed decision-making. The process of creating a KPI dashboard in Tableau involves:
- Integrating various data sources to achieve a unified view of performance metrics
- Utilizing Tableau’s data modeling features to build custom KPI metrics
- Applying visualizations that highlight dashboard KPIs effectively
Moreover, Tableau’s service enables users to share KPI performance dashboards across teams, ensuring that key insights are accessible to all stakeholders. This fosters a culture of data-driven decision-making that is crucial for maintaining a competitive edge in today’s fast-paced business environment.
What Makes a Dashboard User-Friendly?

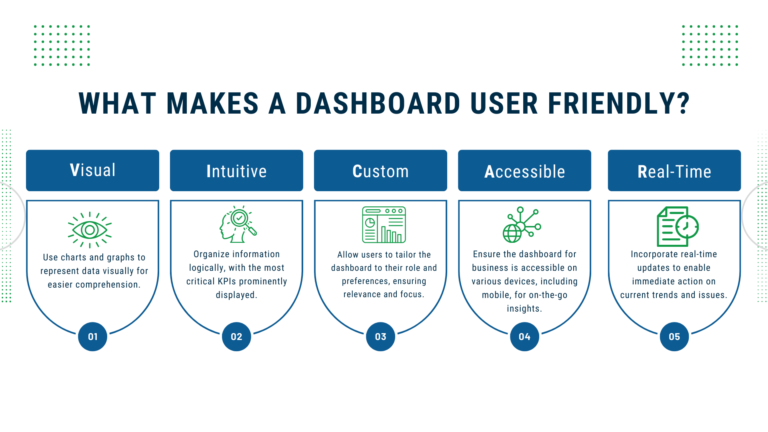
User-friendly dashboards are pivotal for small businesses to effectively monitor and respond to their KPIs. A well-designed business dashboard should prioritize clarity and ease of use to facilitate quick decision-making. Here are key features that contribute to a user-friendly experience:
- Visual Elements: Use charts and graphs to represent data visually for easier comprehension.
- Intuitive Layout: Organize information logically, with the most critical KPIs prominently displayed.
- Customization: Allow users to tailor the dashboard to their role and preferences, ensuring relevance and focus.
- Accessibility: Ensure the dashboard for business is accessible on various devices, including mobile, for on-the-go insights.
- Real-Time Data: Incorporate real-time updates to enable immediate action on current trends and issues.
Ultimately, a small business KPI dashboard should empower users with the right information at the right time, presented in a way that is both comprehensible and actionable.
How often should KPIs be reviewed for business growth?
For small businesses, the frequency of reviewing KPIs is crucial for maintaining momentum and ensuring alignment with strategic goals. Key performance indicators should be examined in tandem with business cycles, which can vary from weekly to quarterly, depending on the specific metric and the pace of the industry.
Real-time data, facilitated by a small business KPI dashboard, empowers owners and managers to make informed, responsive decisions. This agility is particularly beneficial for small businesses that need to adapt quickly to market changes. However, while real-time data is valuable, it’s important not to overlook the broader trends that emerge over longer periods.
- Monthly Reviews: Ideal for tracking progress on short-term objectives and operational adjustments.
- Quarterly Assessments: Useful for strategic planning and aligning KPIs with business growth milestones.
- Annual Analysis: Necessary for evaluating overall performance, setting future benchmarks, and revising long-term business strategies.
It’s also essential to recognize when KPI targets and benchmarks need revision. If a small business experiences significant changes, such as rapid growth, market shifts, or internal restructuring, KPIs should be re-evaluated to remain relevant and effective.
KPI dashboards are not just for large corporations. They are equally important for small businesses, providing a clear, concise view of performance against key objectives. Industries ranging from retail and hospitality to manufacturing and healthcare can leverage these dashboards to drive growth and profitability. By focusing on the right metrics and maintaining a user-friendly, up-to-date dashboard, small businesses can make data-driven decisions that propel them toward their goals.
Related Articles We Think You Would Enjoy Next
Why Do American-Made Brands Keep Losing Money to Hidden Wastage?
As an American-made manufacturer, you've relentlessly optimized your production line, yet three hidden wastage points beyond your view still threaten your profitability and even your business survival.
Read MoreReporting Unleashed: Elevate Your Small Business with SMART Data Reporting
Reporting is often the most overlooked piece of data analytics. Reporting is the key cog in the data analytics.
Read More

