As an American-made manufacturer, you've relentlessly optimized your production line, yet three hidden wastage points beyond your view still threaten your profitability and even your business survival.
Read MoreMarketing today is a battleground—and the brands with better data win. If you’re still making decisions based on gut feel, last month’s report, or spreadsheets that take hours to update, you’re already behind. CMOs and marketing leaders are under more pressure than ever to justify spend, optimize performance, and prove ROI. But here’s the kicker: most teams are still stuck reacting to the past instead of steering the future.
According to Salesforce (2024), 64% of marketing leaders say data-driven strategies are critical to success. Meanwhile, a Forrester-backed study shows that businesses using first-party intent data see a doubling of conversion rates and a 30% reduction in customer acquisition costs—when they engage prospects at the precise moment with trusted, internal insights. If you’re not making just-in-time decisions based on the right insights, you’re missing critical opportunities to act when it actually matters.
That’s where Tableau comes in. It turns raw marketing data into interactive dashboards that surface what’s working, what’s not, and what to do next—all without waiting for next month’s reporting cycle.
In this article, you’ll learn:
If you’re tired of drowning in disconnected reports and want to start driving performance with clarity and confidence, keep reading.
There are plenty of tools that claim to help marketers visualize data—Google Looker Studio, Power BI, even native dashboards in platforms like HubSpot or Meta Ads. But most of them hit the same wall: rigid templates, limited flexibility, and a constant need for manual updates or workarounds. Tableau changes the game by giving marketers control of their own insights. Here’s what makes it different:
Most tools are static. Tableau is dynamic. With drag-and-drop functionality, filters, and drill-down options, marketers can slice data instantly without writing SQL or waiting on a data team.
Whether your data lives in Shopify, Salesforce, Klaviyo, Google Ads, or Snowflake, Tableau connects directly and refreshes automatically. That means fewer spreadsheets, fewer exports, and more time acting on insights.
The goal isn’t charts. It’s clarity. Tableau’s design engine helps you build dashboards that not only look good but make decision-making faster. Visual best practices are baked in, and templates can be customized to fit any funnel, campaign, or KPI.
Most enterprise BI tools are built for IT. Tableau gives marketing teams the same power with a much shallower learning curve. It scales from startup to Fortune 500 without losing speed or usability.
According to Dresner Advisory (2024), Tableau users experience 40% faster time to insight than traditional reporting tools. In today’s environment, faster insights mean faster optimization—and faster growth.
Bottom line? Tableau gives you the flexibility of Excel, the power of a data warehouse, and the usability of a whiteboard. That’s why it’s not just a dashboard tool—it’s the backbone of modern marketing operations.
Tableau isn’t a one-trick pony—it’s a multi-tool for modern marketers. Whether you’re running lean or managing a multi-channel enterprise campaign, here are the top five ways teams are using Tableau to unlock revenue-driving insights:
See what’s working—before the budget burns. Tableau allows you to monitor campaigns by channel, creative, audience segment, or region in one place. Instead of waiting for end-of-month reports, you can pivot in real time to optimize for CAC, ROAS, and LTV.
First-click, last-click, or full-funnel? Build your own attribution logic in Tableau—no black-box algorithms required. Marketing leaders use it to allocate spend more efficiently, prove the impact of top-of-funnel channels, and answer the age-old question: “What’s actually driving conversions?”
Pull customer behavior data from Klaviyo, GA4, or your CRM and visualize how different audiences engage, convert, and churn. Identify profitable segments, and personalize your creative and messaging based on actual behaviors—not assumptions.
Map every stage of your marketing funnel—from ad impression to SQL—in one view. Pinpoint where leads are leaking and where velocity slows. Bonus: Sales teams will love you for finally syncing their goals to your dashboards.
Overlay spend data with performance KPIs to see where your dollars are over- or under-performing. Want to reallocate budget mid-month? Tableau gives you the confidence to do it with data, not guesswork.
According to HubSpot (2024), marketers who use visualization tools are 28% more likely to hit lead gen goals. Tableau isn’t just helping marketers report the news—it’s helping them write it.
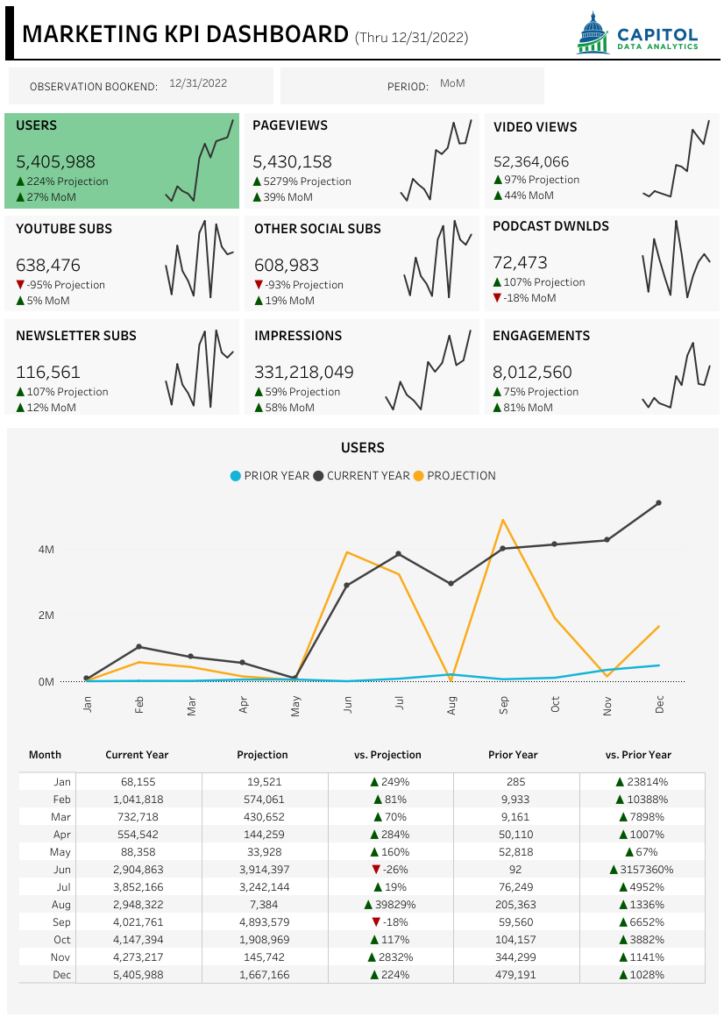
Samin runs a fast-growing content company that monetizes through advertising. But selling ad space meant proving value to clients—and the data was everywhere. YouTube, newsletters, podcasts, impressions, subscribers—spread across 20 platforms, each with its own quirks.
The result? Missed opportunities and wasted time.
With Tableau, Samin pulled it all together into one clear, cohesive Marketing KPI Dashboard. In seconds, he could show potential advertisers a unified snapshot of reach, engagement, and growth—no more screenshots, no more spreadsheets. Just clean, trustworthy data.
Tableau became his sales enablement weapon—and helped turn data into deals.
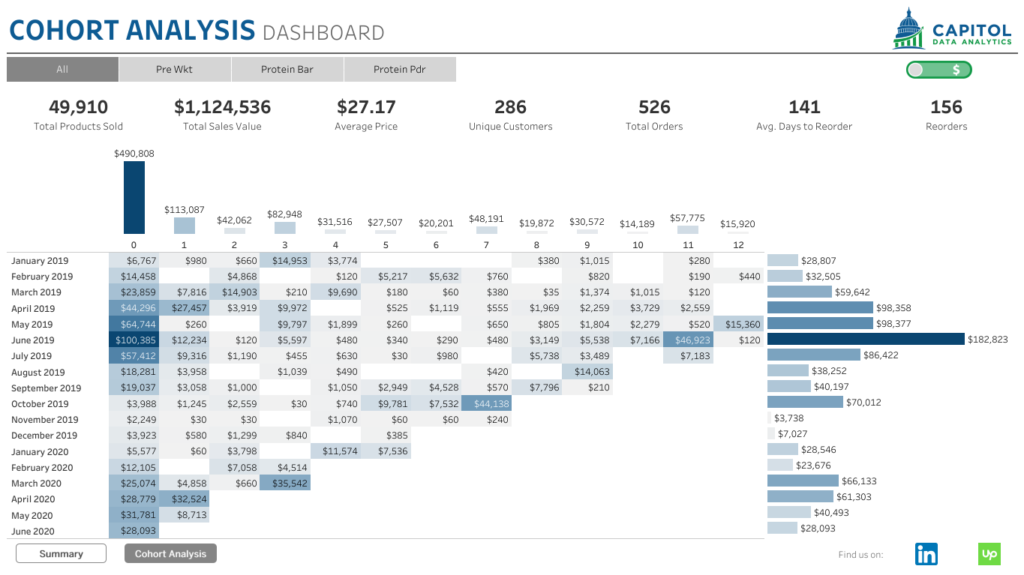
Thomas was running a supplement company with strong first-time sales—but retention was murky. He needed to know which customers were repurchasing, when, and how much they were worth over time.
That’s where Tableau’s Cohort Analysis Dashboard changed the game.
Instead of guessing, Thomas tracked reorder behavior down to the SKU, channel, and cohort. He learned that certain products led to higher reorder rates, and that customer value looked drastically different depending on the first month of purchase.
Armed with insight, Thomas reallocated budget toward the highest-retention acquisition channels—and extended customer lifetime value by over 30%.
The dashboard didn’t just reveal the data—it showed a path to growth.
Both dashboards work because they do what great dashboards should:
In the hands of marketers, Tableau becomes a tool of leverage—not just analysis.
Marketing isn’t getting easier. The stakes are higher, the channels are noisier, and the pressure to prove ROI is relentless. What separates winning brands from the rest isn’t access to data—it’s how quickly and confidently they can act on it.
Throughout this article, you’ve seen how Tableau:
If your team is serious about growth, it’s time to upgrade from reactive reporting to proactive performance management. Tableau doesn’t just help you measure what happened—it helps you change what happens next. Bottom line: The teams with clarity move faster, learn faster, and grow faster. Tableau is how they get there.
As an American-made manufacturer, you've relentlessly optimized your production line, yet three hidden wastage points beyond your view still threaten your profitability and even your business survival.
Read MoreTransform dashboard failure into success. Learn why 90% of BI dashboards fail and discover the proven framework to build dashboards that drive action.
Read MoreWhat are essential KPIs for small businesses?
Read More