The LIVEN Approach to Dashboarding
Summary
Dashboards are the lifeblood of business reporting, but how do you know that the dashboard you are building will be valuable to the end user? We found the answer in Judah Phillips’ Ecommerce Analytics and it is the LIVEN approach to dashboard building. This acronym provides you with the keys to making a valuable dashboard that will surely liven your user’s reporting experience.
Bad joke aside, this article will walk you through what the LIVEN approach is and show you how it applies to a real live dashboard built by CDA. By the end of the article, you will be able to apply the LIVEN approach to your dashboard build outs.
What is the LIVEN approach?
- Linked – The big takeaway here is you need to link to then necessary data to provide context in your dashboard. Kind of a no duh, but you need the correct data to produce the correct visualizations and it needs to be updated on the correct interval.
- Interactive – One of the best things about a dashboard is its interactivity. Being able to slice and dice the data on the fly allows users to find exactly what they are looking for without having to ask for further data pulls. Do not go overboard here. The dashboard interactivity should serve to answer specific questions and not try to answer every question the user has.
- Visual – A dashboard is not a data dump (think excel file). A rule of thumb I use is you should be able to figure out a dashboards purpose within a minute or two of opening it. If you don’t know what is going on or you need a 60-page manual to understand the dashboard, the visuals are not effective.
- Echeloned – This term refers to the order of the data within the dashboard. It is common practice to put the high-level detail at the top of the dashboard and have the lowest level detail at the bottom of the dashboard. This flow keeps the user moving in a cohesive way that makes the data easier to understand.
- Narrative – Dashboards should tell a narrative. This can be done explicitly by adding text and callouts or implicitly by using coloring and comparison metrics on the dashboard. A strong narrative helps the user to understand the important details of the dashboard and drive action within the business.
Applying the LIVEN approach
Now that you know what the LIVEN approach is. Let us see it in practice.
LIVEN
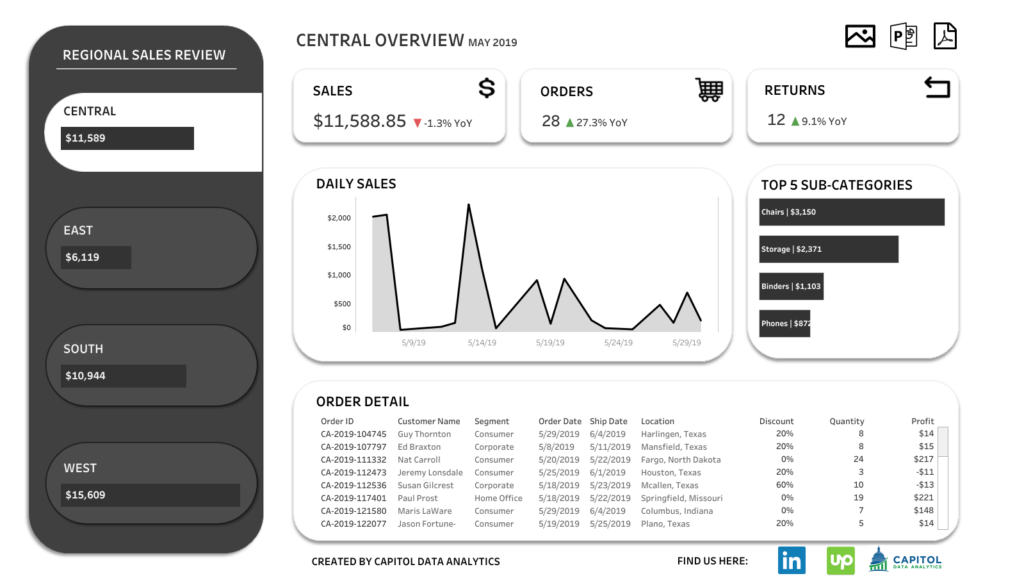
- Linked – This dashboard is linked to Tableau’s superstore sample dataset. This data provides the context for our transaction details. These transaction details provide us with the necessary information to answer our questions.
- Interactive – If you click under regional sales review on the dark pills you can filter the dashboard to show the dashboard information by sales region for the company. This interactivity allows quick and easy filtering to understand our regional sales. Additionally, the icons at the top right allow for quick exports so the dashboard views can be used in sales presentations.
- Visual – There is one data dump type visual with the order detail, but the rest of the visualizations provide quick context. For instance, it is easy to see the West Region is leading all regions in sales. Also, the top 5 sub-categories chart shows us quickly what is selling the best and how much more sales we are receiving in position 1 vs position 5.
- Echeloned – This dashboard is arranged with our high level KPIs at the top and transactions at the bottom. This flow goes from highest level to lowest level of detail and is easy to track.
- Narrative – While the dashboard does not have explicit callouts, it does have some strong implicit callouts. The best example of this is the coloring and up and down triangles in the KPIs. With the rest of the dashboard being darker colors, the green and red of the triangles draws the eye in and immediately tells the narrative of how sales are doing this year vs the previous year.
Now that you understand the LIVEN approach. You can start to apply it to your dashboard builds. This approach gives you the keys to ensuring that your end user will value your dashboard.
If you are struggling to drive data driven decisions with your reporting and analytics, contact us today to LIVEN up your solutions.