
Grade Your AI Like an Employee: The Scorecard That Shows Whether It Pays
To tell whether an AI tool is paying off, tie it to one number you already track, record where it stands before the tool starts, and set two levels in advance: the break even level that covers the tool’s full cost, and the target that counts as success. On a set date, keep it, fix it or cut it.
Every week someone tells you that you are behind on AI. Your CRM adds an AI button and a line to the invoice. A vendor at the trade show promises an AI receptionist that books jobs while you sleep. Your sales manager forwards a video. Every pitch sounds urgent, every demo looks good, and none of them come with a way to check.
So you freeze. Or you buy one, the bill arrives every month, and the dashboard says it recovered more revenue than you can find in QuickBooks. Renewal comes up and you still cannot say whether it earned its fee. You have bought software before that looked great in the demo and quietly did nothing.
What is missing is a way to judge the tool in front of you. This page gives you that as a single sheet: the number the tool has to move, the level that counts as success, and the date you decide. Print the blank scorecard, fill it in for the tool you are paying for or considering, and the next AI pitch gets a yes or a no.
Why does an AI tool have to move a number you already track?
An AI tool is only worth paying for if it moves a number your business already runs on: speed to lead, set rate, close rate, cost per booked job, margin or cash. If you cannot name the number before you buy, you will not be able to see whether it paid.
Hold it to the same standard as a new hire. You would not keep a salesperson because they seemed busy; you would keep them because their appointments turned into signed jobs. An AI tool that answers leads, follows up appointments or checks invoices gets the same test, on the same scorecard your managers already read. If your departments do not have that scorecard yet, start with the KPIs each department should own.
Which number should each kind of AI tool move?
Each AI tool should move one leading number, which changes within weeks and shows the tool is doing its job, and one lagging number, which changes over a sales cycle and shows the job paid. Pick both from the table before the tool goes live.
| If the AI tool… | Leading number (moves first) | Lagging number (proves it paid) |
|---|---|---|
| Answers, texts and books new leads (an AI receptionist) | Speed to lead (median); contact rate; set rate | Run appointments; cost per booked job; cash collected in QuickBooks |
| Follows up appointments that did not sign | Share of unsigned appointments that get a second visit or call | Close rate on run appointments |
| Confirms appointments the day before | Demo rate (appointments run ÷ issued) | Net sales per lead issued |
| Drafts proposals and estimates | Days from appointment to proposal | Close rate; gross margin at signing |
| Checks supplier invoices against orders | Invoices checked each week | Dollars of credits recovered |
| Tracks permits, materials and job gates | Backlog ready to start | Days from sold to start |
Three rules keep this honest. Take every number from a system you control, your CRM, QuickBooks or ad accounts, not from the tool’s own dashboard. Measure only the leads or jobs the tool actually touches: an after hours assistant is judged on after hours leads, the ones created outside office hours. And keep the definitions fixed: set rate is appointments set ÷ leads received, demo rate is appointments run ÷ appointments issued, and close rate is sales ÷ appointments run.
How do you set the level that counts as success?
Set three lines on each number before the tool goes live: the baseline (where it stands today), the floor (the smallest change that pays for the tool) and the target (the level that counts as a win). Writing them down first is what stops anyone, including you, from moving the goal posts later.
The baseline is the average of the last three months, measured exactly the way you will measure it afterward. If the definition changes, the comparison is worthless. If your volume swings with the season, compare rates per lead rather than counts, or use the same months last year. If the tool is expensive, route a share of its leads around it for the first few weeks as a holdout; it is the same test you would ask of a vendor.
The floor comes from simple math. Divide the tool’s full monthly cost by the gross profit on one job, and you get the number of extra signed jobs it must produce to break even. Full cost means the subscription, setup spread over a year, and the hours your people spend running it, priced at their loaded hourly wage. Gross profit per job is your average contract times your gross margin at signing (contract price minus estimated job cost). Say the tool costs $1,800 a month all in and your average job earns $6,000 in gross profit: it has to add about one signed job every three months. The floor is usually lower than owners expect, which is exactly why it needs a baseline. One extra job a quarter is easy for a vendor to claim and impossible for you to see without one.
To put a floor on the other rows, add it to the baseline and work backward through your own rates. In the example below, 8.4 signed jobs plus 0.3 is a floor of 8.7; at a 30% close rate that takes 29 run appointments, and at an 85% demo rate about 34 set appointments, a 23% set rate on 150 leads. For a tool that saves money instead of winning jobs, such as an invoice check, the floor is simpler: credits recovered or hours saved, in dollars, must cover the full monthly cost.
The target comes from your own best weeks. When CDA set a benchmark for our own website articles, we charted every article’s first eight weeks and set the bar at the average of our top 20%: a level we had already reached, not one we hoped for. Do the same here: chart the number week by week over the last three to six months and take the average of your best fifth of weeks. A good tool should make your best weeks normal. If you have no history at all, pick a reasonable number, run the first month, and reset it once; a rough target you adjust beats waiting for perfect data.
Then put a check date on the sheet, far enough out to get past the learning curve, when most teams dip before they improve. For leading numbers that usually means 30 to 60 days; for lagging numbers, at least one full sales cycle.
How do you build the scorecard, step by step?
You can fill in the scorecard for one tool in about an hour, with your CRM and QuickBooks open. Do it before you sign, or this week for a tool you already pay for.
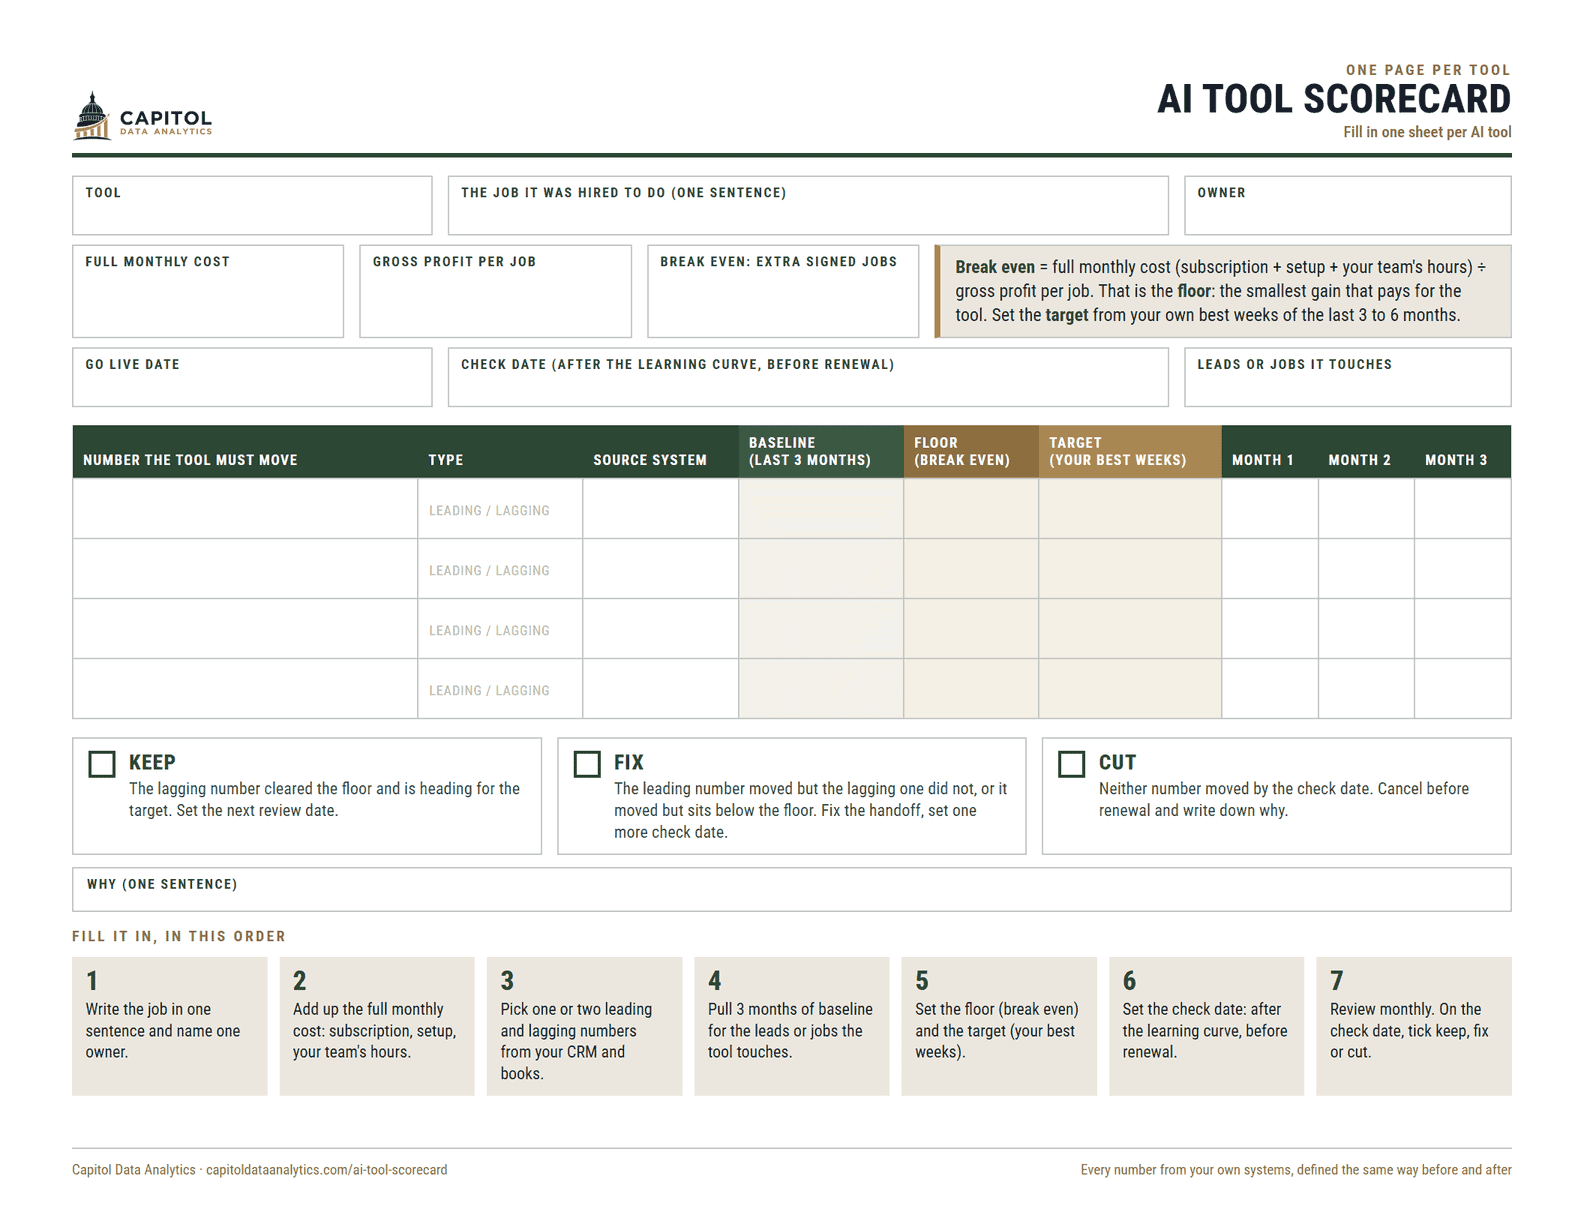
- Write the job in one sentence. “Answer and book web leads that arrive after 6 p.m.” If nobody can say what the tool was hired to do, that is the first finding.
- Name one owner. The person who checks its work, answers for its numbers and brings the sheet to the monthly meeting.
- Add up the full monthly cost. Subscription, setup spread over a year, and the hours your people spend on it at their loaded hourly wage.
- Pick the numbers. One or two leading and one or two lagging, from the table above.
- Pull the baseline. Three months from your CRM and books, using the definitions you will keep, filtered to the leads or jobs the tool will touch.
- Set the floor and the target. Floor from the break even math; target from your best weeks.
- Set the check date. After the learning curve, and before the renewal date.
- Review monthly; decide on the date. Keep it if the lagging number cleared the floor and is heading for the target. Fix it if the leading number moved but the lagging one did not, or if the lagging number moved but sits below the floor; the usual fix is the handoff to your team, then one more check date. Cut it if neither moved.
A tool that cannot hold a row on that sheet should not hold a line in the budget.
If you would rather have the baseline pulled and the levels set from your own data, that is part of what a free Profit Leak Audit does: it reads your CRM, ad accounts and books and gives you the numbers any tool should be judged against.
When can you trust an AI vendor’s numbers?
You can trust a vendor’s numbers when they would pass the same scorecard: a stated baseline, definitions that match yours, a fair comparison and records you can check. Plenty of vendors report results honestly, and when they do, their numbers are a useful early read on the leading measures.
Look for four things in any vendor report:
- A baseline. What the numbers were before the tool, over what period.
- Your definitions. “Booked” should mean the same thing in their report and yours: an appointment set, an appointment run, or a signed job are three very different claims.
- A fair comparison. Before and after on the same kind of leads, or a share of leads routed around the tool for a few weeks as a holdout.
- Records you can export. Lead by lead, so you can tie their results to your CRM and to cash in QuickBooks.
Be careful with “recovered revenue” that is calculated as appointments times your average job size. An appointment is not a sale, and that math ignores the jobs that did not sign, the ones your team would have booked anyway, and cancellations. If a vendor cannot show the four things above, use your own scorecard and read the contract the way you would any software contract before the renewal date.
What does a filled in scorecard look like?
Here is a completed scorecard for one common case: an AI assistant that answers and books web leads arriving after hours. The company and numbers are an illustration, not a client: a $20M siding and window company with about 150 after hours leads a month.
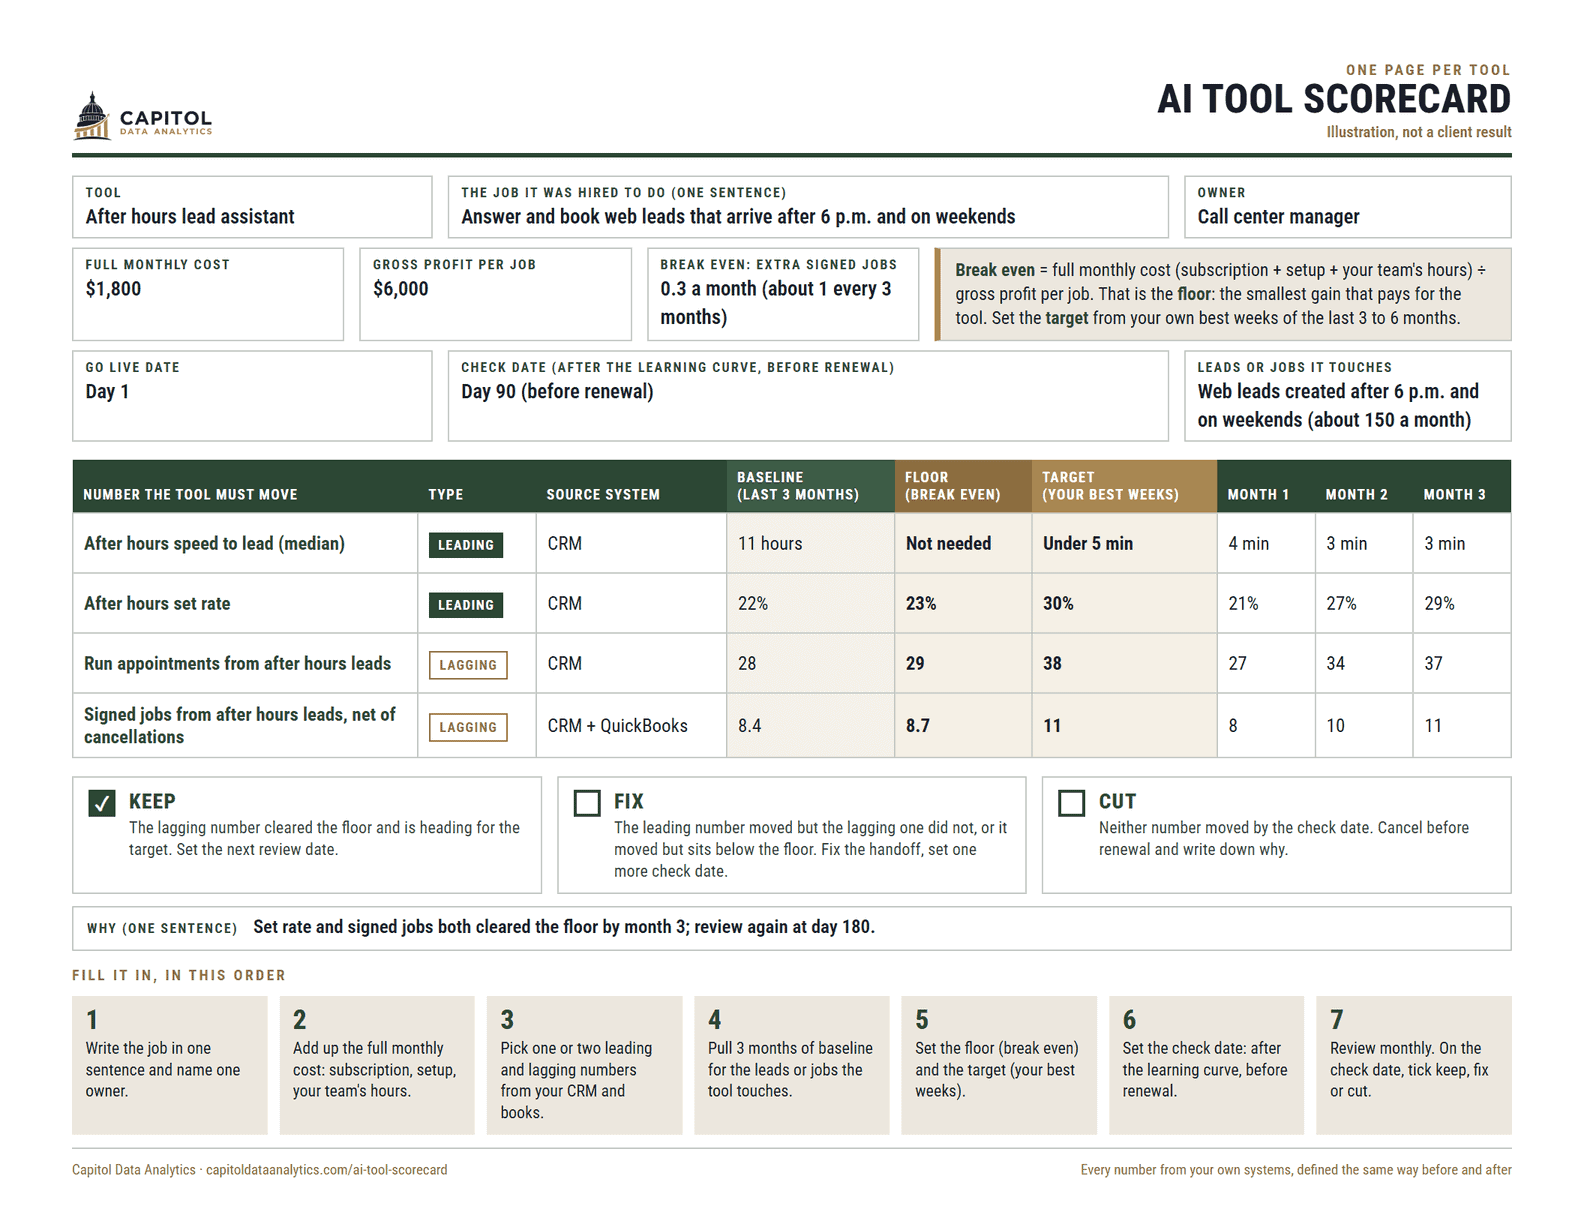
Before go live, the owner wrote the job (“answer and book web leads that arrive after 6 p.m. and on weekends”), named the call center manager as owner, and added up the full cost at $1,800 a month. At $6,000 gross profit per job, the floor was about one extra signed job every three months. The baseline showed after hours leads waiting a median of 11 hours, setting at 22%, and producing about 8 signed jobs a month. The target, from the company’s best weeks, was a 30% set rate.
Month one dipped while the team learned the handoff: set rate fell to 21%. By month three, speed to lead was down to 3 minutes, set rate reached 29%, and after hours leads produced 11 signed jobs, about three more than the 8.4 baseline and well past the floor. Over the three months that is about four extra signed jobs, roughly $22,800 of gross profit against $5,400 of cost. On the check date the decision was keep, with the next review in 90 days. Had set rate climbed while signed jobs stayed flat, the decision would have been fix, starting with how the assistant hands appointments to the sales team.
For where AI tends to pay first and what to fix before you buy, start with AI for home improvement companies. If you want this scorecard built from your own numbers, a free Profit Leak Audit is where CDA starts. The findings are yours either way.
Frequently asked questions
How do you measure the ROI of an AI tool?
Tie the tool to one number your business already tracks, such as set rate or close rate, and record its three month baseline before the tool starts. Set a break even floor from the tool’s full monthly cost divided by gross profit per job, and a target from your best weeks. On a set date, compare against both using your own CRM and books.
What is a good break even point for an AI tool?
Divide the tool’s full monthly cost, including your team’s time, by the gross profit on one job. At $1,800 a month and $6,000 of gross profit per job, the tool must add about one signed job every three months. The bar is often low, which is why you need a baseline to see whether the tool actually cleared it.
How long should you test an AI tool before deciding?
Long enough to get past the learning curve and through one sales cycle. Leading numbers like speed to lead and set rate usually show a change in 30 to 60 days. Lagging numbers like close rate and signed jobs take as long as your jobs take to sign. Put the check date on the scorecard before the renewal date.
Can you trust an AI vendor’s ROI numbers?
Sometimes. Trust them when the vendor states the baseline, uses your definitions of a booked appointment and a sale, compares fairly against before or a holdout, and lets you export records to tie results to your CRM and QuickBooks. Be wary of revenue calculated as appointments times average job size, which ignores unsigned and canceled jobs.
How do you know if your AI receptionist is working?
Judge it only on the leads it answers, usually after hours. Compare speed to lead, set rate and signed jobs for those leads against the three months before it started, in your own CRM. If set rate rose but signed jobs did not, fix the handoff to your sales team before you blame the tool.
What should an AI tool scorecard include?
The job the tool was hired to do, one owner, the full monthly cost, one or two leading and lagging numbers from your own systems, a three month baseline, a break even floor, a target, a check date, and the keep, fix or cut decision. One page per tool, reviewed monthly.
Get the baseline before you buy
A free Profit Leak Audit reads your CRM, ad accounts and books and gives you the baseline and break even levels any AI tool should be judged against. The findings are yours either way.
Get your free Profit Leak Audit