Learn how lookalike modeling can help you find new customers who match your best customers.
Read MoreIf you’ve ever dived into the depths of the internet searching for insights on Customer Lifetime Value (CLV), you might have found yourself swimming through a sea of superficial advice and basic tutorials that barely scratch the surface. That was precisely my experience when I was spearheading CLV projects, aiming to revamp our approach in a competitive market. My quest for advanced methodologies led us down a rabbit hole of overly simplified guides and articles filled with jargon that offered little to no practical value for dealing with complex, real-world data and customer interactions. Now, I’m here to fill in the blanks and share the wealth of knowledge I amassed along the way.
Welcome to the comprehensive guide on Customer Lifetime Value that you’ve been searching for. Grab a bathroom break and a drink, because you will be unpacking a lot of value.
In this article, I’ll navigate:
What is Customer Lifetime Value and Why is it Important?
How do you calculate customer lifetime value (CLV)?
How To Use Customer Lifetime Value Effectively
Supercharge CLV With Other Business Data
CLV FAQ
Customer Lifetime Value (CLV) is the cumulative value a customer contributes to a retailer throughout their lifetime, from their initial to their final purchase. Value, in this context, can initially seem straightforward, equating simply to revenue – the total expenditure by the customer. However, my experience as a marketing data scientist has revealed that more established retailers prioritize profitability over revenue. This perspective shifts the definition of value to a more nuanced calculation of revenue minus associated costs. The lifetime part of the calculation is defined as the specific period of time the business wants to measure performance.
Recognizing the significance of customer lifetime value is vital for companies aiming to increase customer value by focusing on customer engagement and retention strategies. By measuring CLV, businesses can improve customer loyalty, boost CLV, and ultimately increase their business value. Moreover, CLV assists in refining marketing initiatives across the customer journey. When CLV is low, it’s crucial to dissect the underlying issues and adopt strategies aimed at increasing the lifetime value of a customer. The next sections will discuss how to measure customer lifetime value.
Understanding Customer Lifetime Value (CLV) is crucial for businesses. Mastery of this calculation allows companies to navigate more effectively through marketing strategies, customer acquisition expenses, and the broader landscape of profitability. Broadly, there exists two methodologies for customer lifetime value calculations: historical and predictive value calculations.
The historical calculation of CLV involves delving into past customer interactions and expenditure patterns to calculate the revenue a customer generated. These historical patterns are then generalized to predict future CLV across every customer. This technique, grounded in concrete customer data, tends to offer a reliable estimate of a customer’s value. However, it only looks to the past to directly measure value, so it has limited use. This calculation provides a solid foundation of knowledge if you had no prior knowledge of your lifetime value.
Conversely, the predictive approach employs statistical models and machine learning algorithms to anticipate future customer actions and potential spending. Despite its complexity and the need for more extensive data analysis, this forward-looking method equips businesses with profound insights into upcoming revenue inflows. These models can also help explain what makes up higher clv customers leading to creating more valuable customer acquisitions.
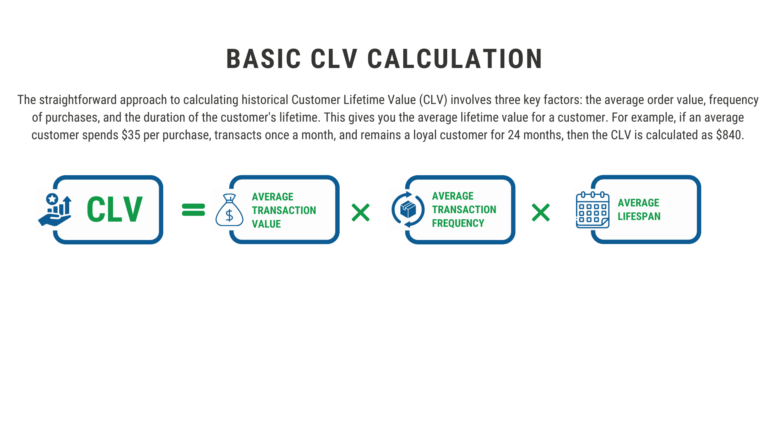
The most straightforward approach to calculating historical Customer Lifetime Value (CLV) involves three key factors: the average order value, frequency of purchases, and the duration of the customer’s lifetime. This gives you the average lifetime value for a customer. For example, if an average customer spends $35 per purchase, transacts once a month, and remains a loyal customer for 24 months, then the CLV is calculated as $840.
To add a layer of complexity and realism, incorporating profit margins into the calculation refines the CLV to represent Customer Lifetime Margin. In this variant, an average profit margin per product is calculated across your entire inventory. This margin is then applied to the basic CLV formula to estimate an average Customer Lifetime Margin. For instance, using the previous example with an added average product margin of 15%, the adjusted CLV becomes ($35 * 1 * 24) * 0.15 = $126.
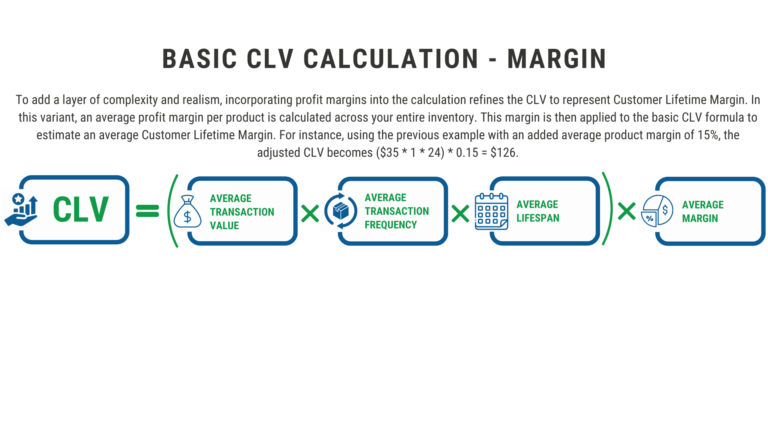
Calculating the average profit margin typically involves subtracting the Cost of Goods Sold (COGS) from the standard catalog price. This simple method, however, doesn’t account for variances in sale prices, different products’ margins within a single transaction, or complex costs. It is however, an improvement over the most basic CLV Calculation.
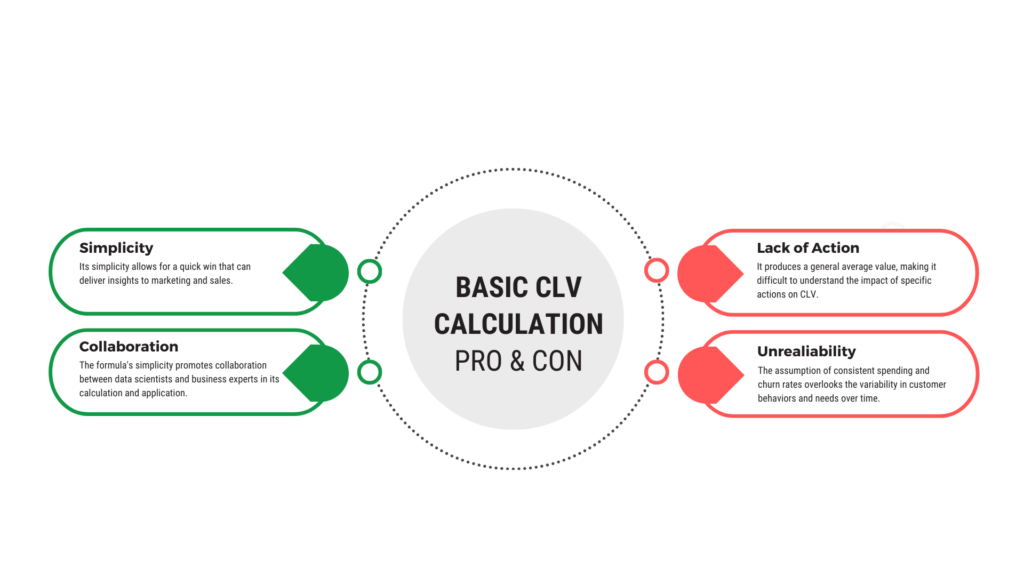
Advantages:
Limitations:
However, the formula faces two primary drawbacks.
Cohort Analysis takes a more segmented route to calculating Customer Lifetime Value (CLV) by applying the customer lifetime value formula to specific groups of customers called cohorts. These cohorts can be defined in numerous ways, including demographic characteristics, acquisition channels, or, more frequently, by the month in which customers made their first purchase. This method seeks to shed light on several key aspects:
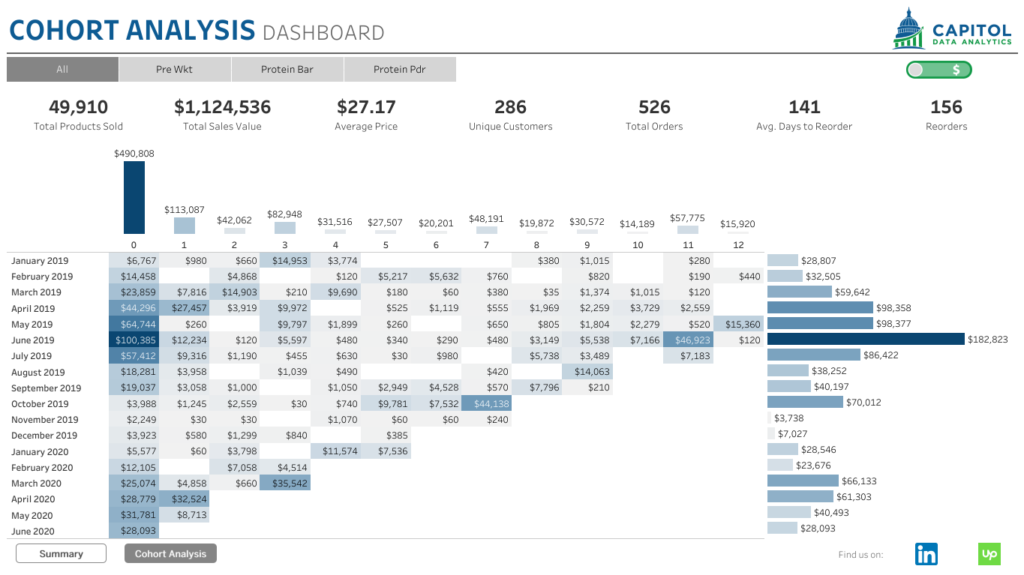
An example of Cohort Analysis can be seen above. It involves categorizing customers by the month of their first transaction (often referred to as the acquisition month). The analysis tracks these cohorts over time, represented along the vertical axis (axis on left) as Cohort Group (indicating their first transaction month) and along the horizontal axis (axis on top) as Months Since First Sale (showing the elapsed months since their first transaction). This approach enables businesses to gain nuanced insights into customer behavior and value over time, providing actionable data to tailor marketing efforts effectively.
Cohort Analysis stands as a strategic approach to customer lifetime value that segments customers into groups for more in-depth analysis, but what are the advantages and challenges of utilizing this method?
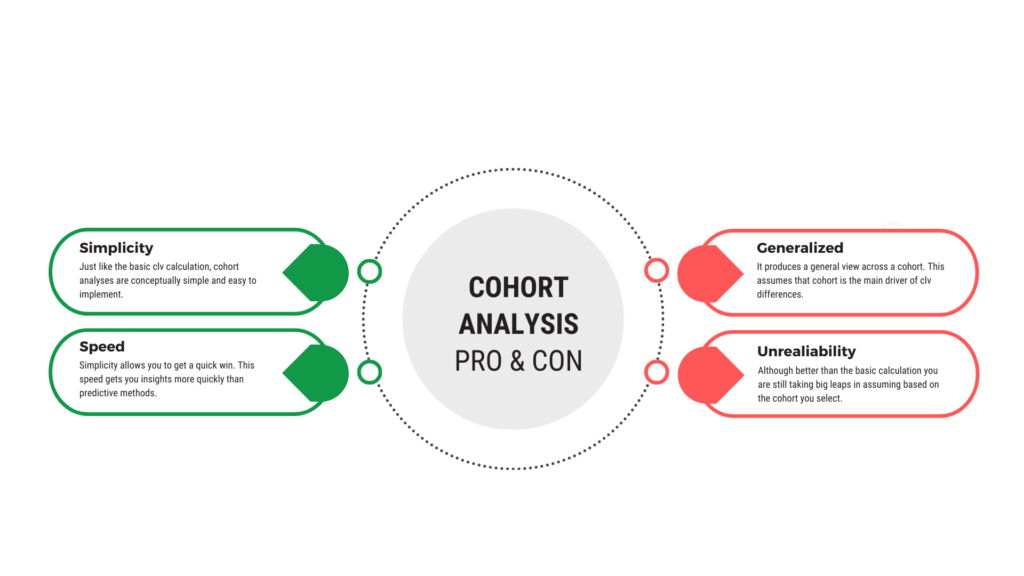
Advantages of Cohort Analysis
Simplicity in Execution: Echoing the ease of the basic CLV formula, cohort analysis is conceptually straightforward and can be implemented without significant complications. This ease of implementation makes it an approachable option for businesses of various sizes and sectors.
Rapid Insight Generation: It serves as an ‘insights quick win’ by rapidly providing valuable data on customer behavior and value over time. This immediate access to actionable data can help businesses adjust their strategies on the fly to better cater to their customer base.
Challenges of Cohort Analysis
Limited Depth of Insight: Despite its ability to segment and provide insights quickly, cohort analysis is not without its limitations. The insights offered are sometimes based on assumptions that may not hold true across all scenarios or for all customer segments.
Assumption-Dependent: The reliance on overarching assumptions can sometimes lead to oversimplified interpretations of customer behaviors, potentially missing out on the nuanced differences within and across segments.
In conclusion, while cohort analysis is a valuable tool for understanding customer value and behaviors, it should ideally be used in conjunction with other methods to determine customer value. It’s effective for quick, broad-stroke insights, but for deeper understanding, predictive analytics may be required to validate and enrich the findings.
Predictive Customer Lifetime Value (CLV) modeling transcends traditional analysis by utilizing advanced data analytics techniques to estimate the future value a customer will bring to a company. This approach leverages various statistical and machine learning methods to predict not just how long customers will stay but also how their spending behaviors will evolve over time. By forecasting future revenue streams from each customer, businesses can optimize their resource allocation, personalize marketing efforts, and strengthen customer loyalty and retention.
Three examples of predictive CLV models include:
Linear Regression Models: These models predict CLV as a linear function of various predictive variables such as purchase frequency, average order value, and customer engagement metrics. They are relatively simple and provide a good baseline model for CLV prediction.
Machine Learning Models such as Random Forest or Gradient Boosting Machines: These models can handle a large set of predictive features and interactions to estimate CLV. They are powerful in capturing complex, non-linear relationships between customer attributes and their lifetime value.
Neural Networks and Deep Learning Models: These advanced models are capable of identifying intricate patterns in large datasets. Recurrent Neural Networks (RNNs), especially those with Long Short-Term Memory (LSTM) units, are useful in predicting CLV by analyzing sequential purchase data and customer behavior over time.
This article does not intend to outline how to build each of these models, but a skilled data scientist should be able to help you utilize these modeling techniques. If you are looking for a skilled data scientist make sure to hit the contact button at the top of the page and schedule a consultation with one of CDA’s skilled data scientists.
Great you have calculated CLV, but now what? CLV can drive better customer support, more effective loyalty programs, and increase customer retention rates. This section explores how to use CLV based on whether you have historical or predictive customer lifetime value models. Note there is crossover, so just because something is listed in historic CLV it could also be added to the predictive approach.
Historical Customer Lifetime Value (CLV) is more than just a backward-looking metric; it’s a treasure trove of insights for data-driven decision-making. Calculating historical CLV involves examining past customer behaviors to understand their value over their lifespan with a company. Here’s how this information can be a game-changer for your business:
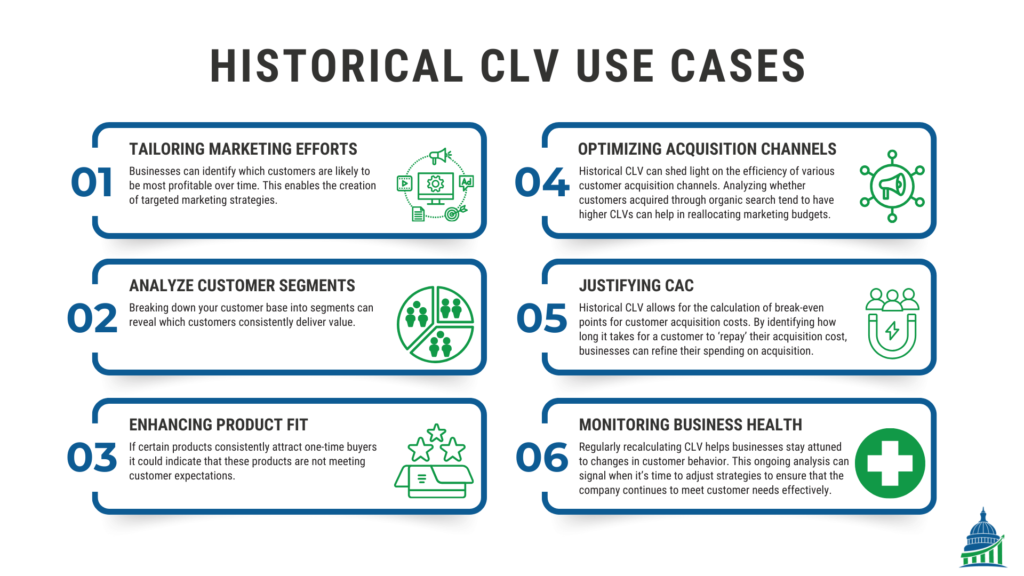
By harnessing the power of historical CLV, businesses can gain a comprehensive view of their customer base, enabling them to make strategic decisions that drive long-term growth and customer satisfaction.
Predictive Customer Lifetime Value (CLV) calculation is a forward looking metric that empowers businesses with the foresight to optimize customer relations and profitability. Through predictive modeling, companies can forecast the future contributions of each customer, guiding strategic decisions in resource allocation, marketing, and customer engagement to bolster loyalty and maximize value.
Predictive CLV enables companies to:
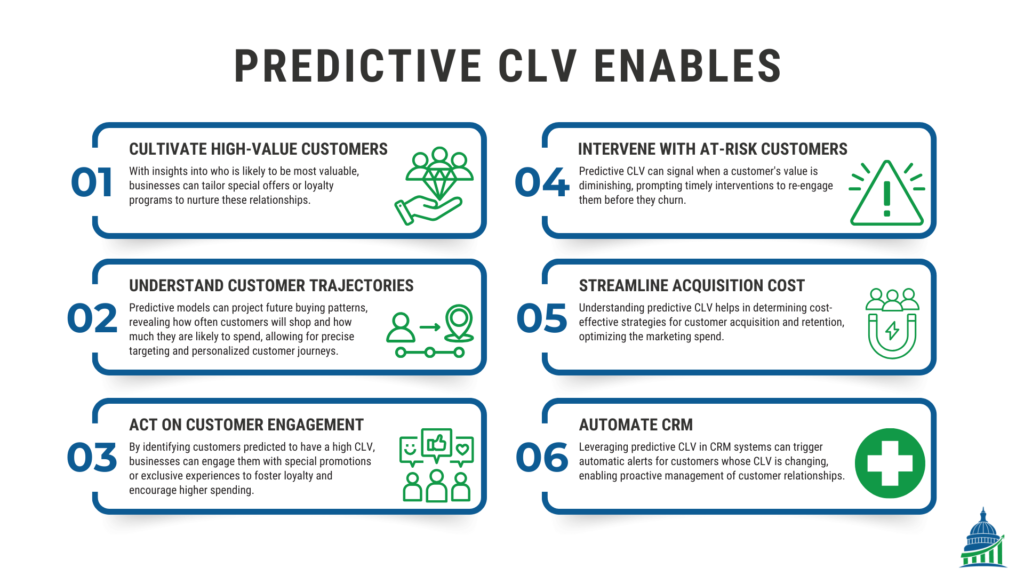
Identify and Cultivate High-Value Customers: With insights into who is likely to be most valuable, businesses can tailor special offers or loyalty programs to nurture these relationships.
Understand Customer Trajectories: Predictive models can project future buying patterns, revealing how often customers will shop and how much they are likely to spend, allowing for precise targeting and personalized customer journeys.
Assess and Act on Customer Engagement: By identifying customers predicted to have a high CLV, businesses can engage them with special promotions or exclusive experiences to foster loyalty and encourage higher spending.
Intervene with At-Risk Customers: Predictive CLV can signal when a customer’s value is diminishing, prompting timely interventions to re-engage them before they churn.
Streamline Acquisition and Retention Costs: Understanding predictive CLV helps in determining cost-effective strategies for customer acquisition and retention, optimizing the marketing spend.
Automate CRM: Leveraging predictive CLV in CRM systems can trigger automatic alerts for customers whose CLV is changing, enabling proactive management of customer relationships.
In summary, predictive CLV calculation is not just about numbers; it’s about anticipating needs, understanding behaviors, and creating strategies that align with the future value customers will bring to a business. This strategic use of data goes beyond reactive measures, setting the stage for sustainable growth and a strong, loyal customer base.
Combining Customer Lifetime Value (CLV) information, whether derived from historical data or predictive models, with other business data can significantly enhance its utility and actionability. By integrating a CLV metric with various data points businesses can uncover deep insights and optimize their strategies across multiple dimensions. Here’s how you can synergize CLV with other business intelligence:
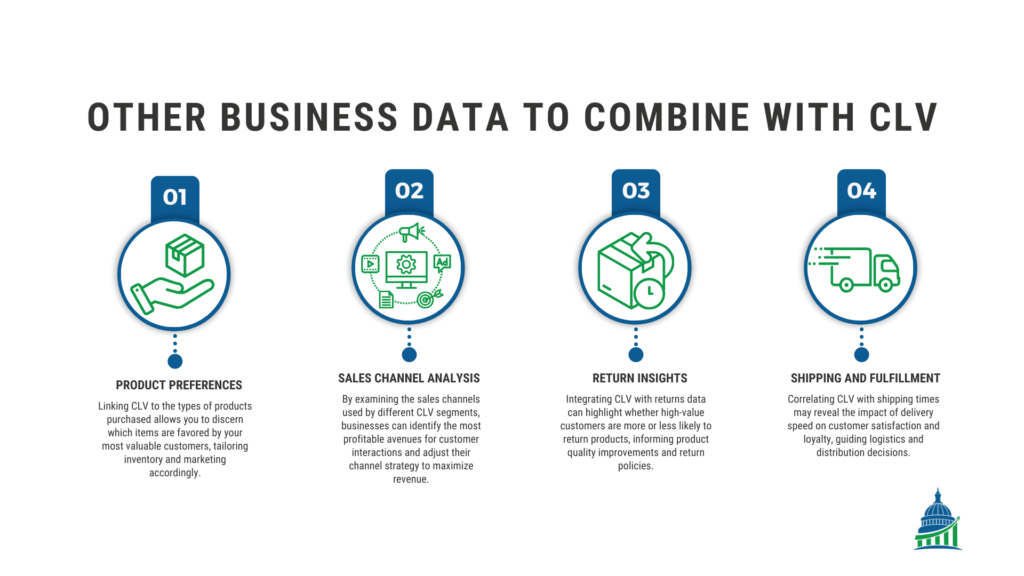
Product Preferences: Linking CLV to the types of products purchased allows you to discern which items are favored by your most valuable customers, tailoring inventory and marketing accordingly.
Example: Imagine an online retail company specializing in electronics. The company analyzes its customer base and segments them according to their CLV. They find that their highest CLV customers frequently purchase premium headphones and smart home devices. Armed with this insight, the company decides to:
This strategic move not only ensures that the inventory aligns with customer preferences but also helps in attracting potential high-CLV customers interested in these product categories.
Sales Channels Analysis: By examining the sales channels used by different CLV segments, businesses can identify the most profitable avenues for customer interactions and adjust their channel strategy to maximize revenue.
Example: A multi-channel retailer, selling both through physical stores and an online platform, conducts an analysis linking customer CLV to their preferred shopping channels. The analysis reveals that customers with the highest CLV scores predominantly make their purchases online, especially through the mobile app. In response, the retailer:
This strategy helps in optimizing the sales channel mix to favor those preferred by the most valuable customers, potentially increasing overall profitability.
Example: A fashion e-commerce platform integrates CLV data with its returns analytics. They discover that customers in the top CLV tier have a lower return rate compared to other segments, but when they do return items, it’s often due to sizing issues. To address this, the platform:
These initiatives aim to reduce return rates further, enhance customer satisfaction, and solidify the loyalty of high-value customers.
Example: A gourmet food delivery service correlates its CLV data with shipping times and customer feedback. It finds that speedy delivery significantly correlates with high customer lifetime value. Recognizing the importance of fast shipping to customer satisfaction and loyalty, the service:
By focusing on improving shipping and fulfillment processes, the company aims to increase customer satisfaction, encouraging repeat business and enhancing the lifetime value of its customers.
These scenarios illustrate the power of integrating CLV with other business data to uncover actionable insights that can lead to more informed decisions and strategic improvements across various aspects of the business.
This multidimensional approach to data analysis enables a more nuanced understanding of customer behavior, preferences, and their overall profitability to the business. By doing so, companies can make informed decisions that not only cater to the immediate needs of their customers but also contribute to long-term business success.
This section is a grab bag of frequently asked CLV questions that were not already answered in this article.
CLV scoring is the process of providing a predictive CLV score across your existing customer database. A predictive model provides individual customers with a model score, but to make the score more useful it is best practice to create certain customer segments from these single customer scores. An example of this would be to create Low/Medium/High tiers of scores with cutoffs at bottom 10%, middle 80%, and top 10%.
Proper implementation of CLV scoring is vital to improving the customer experience and also increasing the value of each customer. To do this a CRM is often used to automate the scoring algorithm. To further take advantage of automation you can create appropriate alerts across your entire customer database that track significant changes in CLV. These changes may help you identify particular customers that are likely to churn or need to be included in a customer loyalty program.
Good is relative when it comes to CLV among your customers. Similar to a previous answer the key is to segment your customers using CLV to try and gain deeper insights into customer behaviors that will ultimately improve customer lifetime value. An example of this would be to create Low/Medium/High tiers of scores with cutoffs at bottom 10%, middle 80%, and top 10%.
CLV is customer lifetime value and CaC is customer acquisition cost. The trick to this ratio is to balance customers’ lifetime value with cost of acquiring that customer. For CLV/CaC anything above 1 is considered profitable and you would theoretically want to continue maximizing acquiring customers that are at 1 or above on this ratio. One consideration to make is CLV should take into account profit. If you do not calculate profit you will be inflating your CLV, which throws off this ratio.
Learn how lookalike modeling can help you find new customers who match your best customers.
Read MoreA three video series that explores propensity models.
Read MorePropensity models are a group of statistical models that provide immense value to your organization.
Read MoreNOT GETTING THE INSIGHTS YOU NEED? LEARN MORE ABOUT HOW THE CATALYST PROGRAM CAN TAKE THE GUESSWORK OUT OF REPORTING.