
As an American-made manufacturer, you've relentlessly optimized your production line, yet three hidden wastage points beyond your view still threaten your profitability and even your business survival.
Read MoreReporting Unleashed: Elevate Your Small Business with SMART Data Reporting
Reporting is often the most overlooked piece of data analytics. However, reporting is the key cog in the data analytics that lets you do the more advanced work. In this article you will learn what reporting is, different objectives of reports, what KPIs are and how to select them, a framework for effective reports, common reporting challenges and finally a case study that ties the value of reporting to the real world. Let’s get started.
Defining Data Reporting: A Bridge to Informed Decision-Making
At its core, data reporting is the art of transforming raw data into insights. These insights serve as guiding lights for businesses seeking to navigate their way through the complexities of the market. By presenting data in a digestible manner, reports empower decision-makers to discern patterns, trends, and opportunities that might otherwise remain hidden.
Imagine your business as a ship navigating through stormy seas. Reports are the navigational charts, providing you with a clear view of your surroundings and helping you steer toward safe harbors. These reports become particularly powerful when served through specialized analysis or interactive dashboards, where complex datasets are distilled into visually engaging formats.
The Multitude of Report Types
Reports aren’t a one-size-fits-all solution; rather, they cater to a multitude of business needs, each serving a unique purpose. Here are some of the key objectives reports can help achieve:
- Comparison: Reports allow us to examine data by comparing similarities and differences. This often involves analyzing data over different time periods. An example of this is Year-over-Year (YoY) sales comparison, where we observe the growth or decline of sales over successive years.
- Relationships: Data points aren’t isolated; they’re interconnected. Reports help us understand these relationships. For instance, we might find that for every new user acquired, the business generates $18 in revenue. This insight demonstrates the relationship between user acquisition and revenue generation.
- Distributions: How often do specific events occur? Reports shed light on the frequency of events, helping businesses identify patterns. Consider a report that reveals there were 23 new users in the last month. This distribution insight is a valuable piece of the puzzle.
- Compositions: Understanding the breakdown of complex components is crucial. Reports can break down an entity into its fundamental constituents. For example, a report might attribute 30% of new customer acquisition to organic search and 70% to paid search, unraveling the composition of this critical metric.
Unlock the Power of Your Data with Our Reporting Consulting Service! Are you drowning in data but struggling to extract actionable insights? Our team of experts specializes in transforming raw data into clear, concise, and impactful reports. Book a time with one of our knowledgeable experts to get started.
Unveiling Key Performance Indicators (KPIs): The Heartbeat of Business Reporting
In the symphony of data reporting, Key Performance Indicators (KPIs) are the carefully composed melodies that resonate with business goals. These metrics and ratios are the backbone of interpretability in reporting, providing a bridge between raw data and strategic insights. KPIs serve as the compass that directs businesses toward their objectives, offering tangible benchmarks to measure and track over time.
The magic of KPIs lies in their interpretability. Unlike raw data, which can often be overwhelming, KPIs present information in a way that’s relatable and understandable. They bring data to life, narrating a story that executives, managers, and teams can all comprehend. Whether it’s tracking customer satisfaction, monitoring revenue growth, or measuring website traffic, KPIs are the pulse that keeps businesses in tune with their performance.
Selecting KPIs for Business Success
In the intricate dance of business, success is often defined by the ability to set clear goals, measure progress, and adapt strategies accordingly. This is where Key Performance Indicators (KPIs) step into the spotlight, serving as beacons guiding your business toward its objectives. In this section, we unravel the art of selecting KPIs that align with your business’s unique journey.
Creating effective KPIs requires a structured approach, and that’s where the SMART criteria come into play. SMART stands for Specific, Measurable, Achievable, Relevant, and Time-bound. Let’s break down how each of these elements contributes to crafting meaningful KPIs.
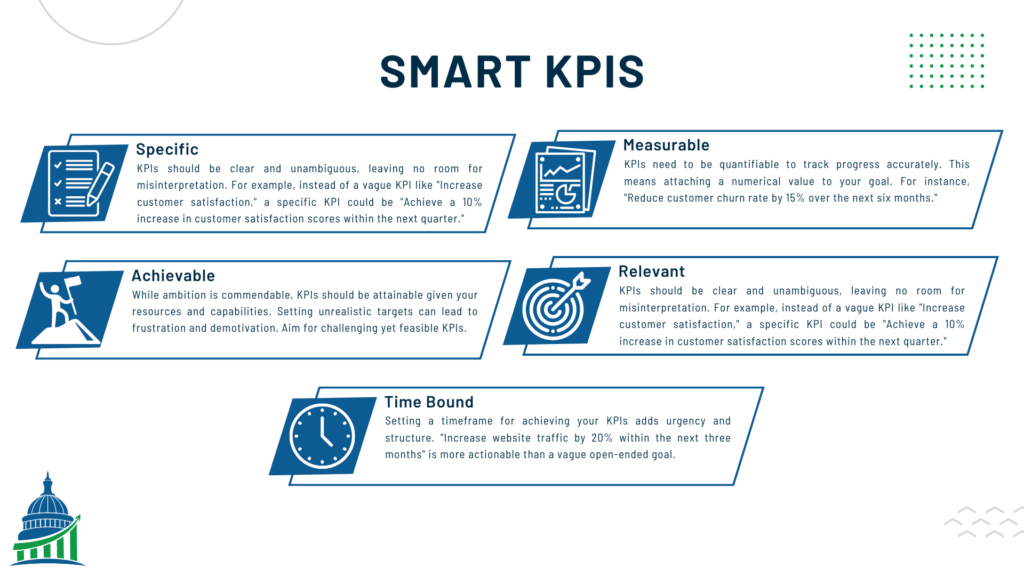
- Specific: KPIs should be clear and unambiguous, leaving no room for misinterpretation. For example, instead of a vague KPI like “Increase customer satisfaction,” a specific KPI could be “Achieve a 10% increase in customer satisfaction scores within the next quarter.”
- Measurable: KPIs need to be quantifiable to track progress accurately. This means attaching a numerical value to your goal. For instance, “Reduce customer churn rate by 15% over the next six months.”
- Achievable: While ambition is commendable, KPIs should be attainable given your resources and capabilities. Setting unrealistic targets can lead to frustration and demotivation. Aim for challenging yet feasible KPIs.
- Relevant: Each KPI should directly relate to your business goals. Avoid the temptation to include metrics just for the sake of measurement. If it doesn’t contribute to your success, it’s not a relevant KPI.
- Time-bound: Setting a timeframe for achieving your KPIs adds urgency and structure. “Increase website traffic by 20% within the next three months” is more actionable than a vague open-ended goal.
KPIs Relevant to Small Businesses
While KPIs come in all shapes and sizes, some are particularly relevant to small businesses aiming to make a big impact. Here are a few categories of KPIs to help you get started:
- Financial KPIs: Keep a keen eye on your revenue, profit margin, and cash flow. These metrics paint a vivid picture of your financial health and sustainability.
- Operational KPIs: Metrics like inventory turnover and lead time help streamline your operations, reducing waste and boosting efficiency.
- Customer-Centric KPIs: Small businesses thrive on customer loyalty. KPIs such as Customer Acquisition Cost (CAC) and Customer Lifetime Value (CLTV) guide your efforts in attracting and retaining customers.
- Employee Performance KPIs: A motivated team fuels growth. KPIs like productivity and turnover rate provide insights into your workforce’s effectiveness and satisfaction.
CDA provides a comprehensive data strategy process that identifies projects like propensity models that can move the needle for your business. If you would need help leveraging data analytics in your business we would love to help. Book a call with one of our experts to get started.
Effective Reporting and Dashboarding: Illuminating Insights for Action
Just like a gourmet dish that’s presented artfully, data analysis needs to be served up in a way that’s not only accurate but also visually engaging and insightful. In this segment, we explore VISTA, an acronym for effective reporting and dashboarding. Use this technique to ensure your reports no longer get relegated to the round bin.
In the grand tapestry of business, effective reporting weaves threads of data into a compelling narrative. Just as a tapestry tells a story through intricate patterns, your reports guide decision-making through carefully crafted insights. By adopting the VISTA approach—prioritizing visualization, understanding your audience, strategic organization, timeliness, and accessibility—you’ll transform your reports into tools that empower your organization to thrive. Embrace the VISTA framework to optimize your reports:
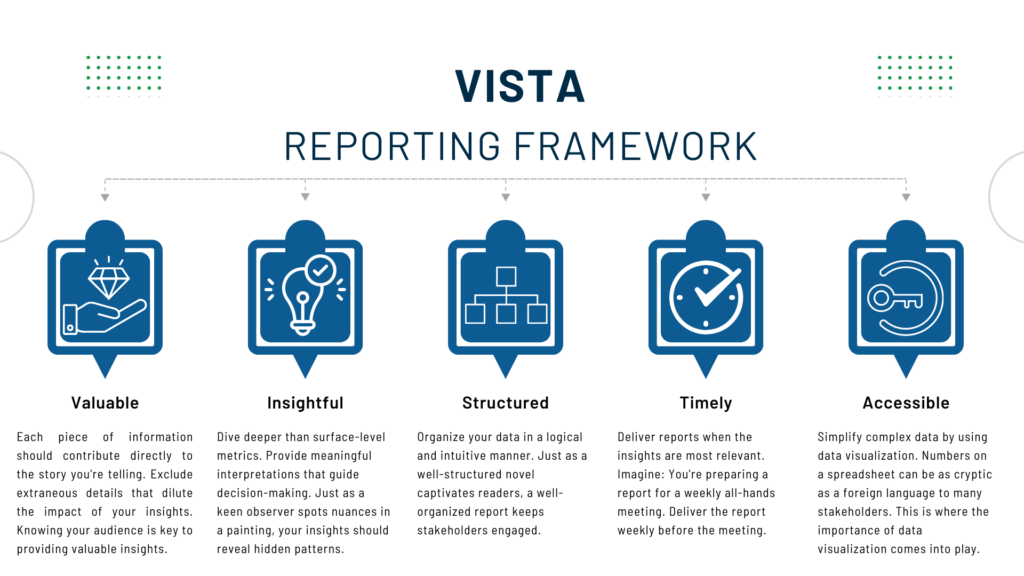
- Valuable: Each piece of information should contribute directly to the story you’re telling. Exclude extraneous details that dilute the impact of your insights. Knowing your audience is key to providing valuable insights. In the grand theater of business, your audience isn’t a homogeneous crowd; it’s a diverse ensemble with different roles and expectations. Customizing reports for various organizational levels is key to maximizing their impact. Present insights that resonate with each audience’s specific goals. For the Chief Financial Officer (CFO), financial KPI reports hold more significance than they might for the CMO.
- Insightful: Dive deeper than surface-level metrics. Provide meaningful interpretations that guide decision-making. Just as a keen observer spots nuances in a painting, your insights should reveal hidden patterns.
- Structured: Organize your data in a logical and intuitive manner. Just as a well-structured novel captivates readers, a well-organized report keeps stakeholders engaged.
- Timely: Timing is key. Deliver reports when the insights are most relevant. Imagine a scenario: You’re preparing a report for a weekly all-hands meeting. This doesn’t mean bombarding the team with hourly reports leading up to the meeting. Instead, sending the report at a reasonable interval before the meeting is both timely and considerate. Timeliness matters, but so does avoiding information overload.
- Accessible: Simplify complex data by using data visualization. Numbers on a spreadsheet can be as cryptic as a foreign language to many stakeholders. This is where the importance of data visualization comes into play. It’s not enough to cook up a sumptuous analysis; it needs to be plated in a way that’s visually appealing and easy to digest. Just like a culinary masterpiece appeals to both your palate and your senses, data reports should stimulate understanding and insight.
Navigating Challenges in Business Reporting
As businesses embrace the data-driven era, they also encounter a series of challenges that require deft navigation. In this section, we delve into common hurdles faced in the realm of business reporting and how to overcome them, ensuring that your journey towards actionable insights remains smooth and fruitful.
1. Managing Data Overload: Focusing on the Signal Amidst the Noise
In an age where information is abundant, distinguishing meaningful insights from the sea of data can be daunting. Managing data overload is an art in itself. It’s not about accumulating every data point available; it’s about identifying the data that matters most to your business goals. Just as a skilled chef carefully selects ingredients to create a harmonious dish, a data analyst curates data to craft a coherent narrative. To conquer this challenge, focus on actionable insights that directly impact your business objectives.
2. Refining KPIs: Adapting to the Changing Landscape
Key Performance Indicators (KPIs) are like compasses guiding your business towards its destination. However, business landscapes are ever-evolving, necessitating periodic recalibration of your KPIs. Much like a navigator adjusting the sails of a ship to catch the changing winds, revisit your KPIs on a specified timeline to ensure they align with your current business needs.
3. Ensuring Data Protection Compliance: Safeguarding Business Integrity
The digital age brings opportunities and challenges, and among them is the crucial concern of data protection. In a world where data breaches can have severe repercussions, ensuring compliance with data protection regulations is paramount. Much like a vigilant sentry guarding a castle, your business must safeguard sensitive information against potential threats.
Stay informed about data protection laws and regulations that apply to your industry and region. Implement robust data protection measures, adopt secure practices, and educate your team about the importance of data security. Just as a safe harbor protects ships from storms, strong data protection measures shield your business from potential breaches.
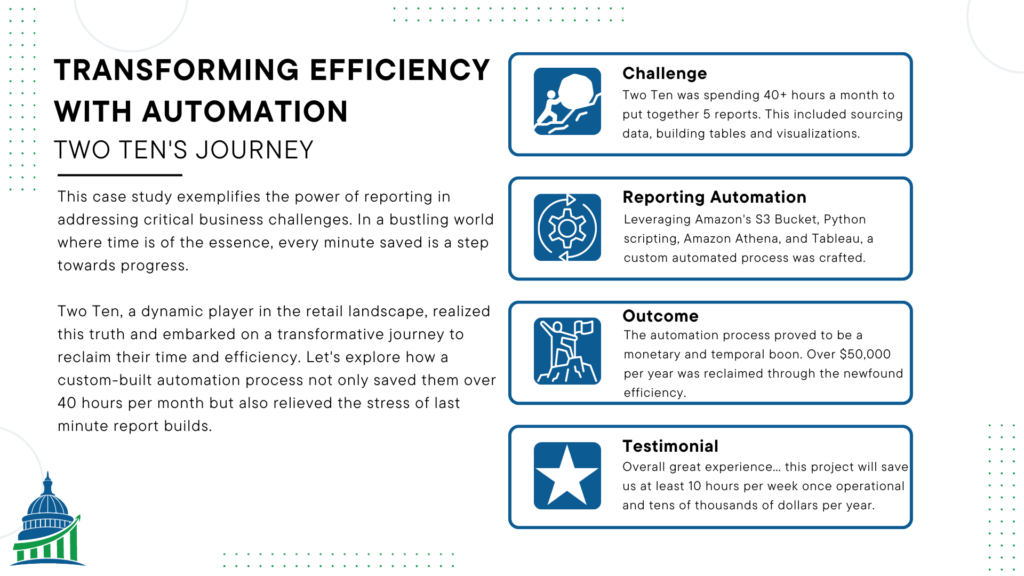
Case Study: Transforming Efficiency with Automation – Two Ten’s Journey
In a bustling world where time is of the essence, every minute saved is a step towards progress. Two Ten, a dynamic player in the retail landscape, realized this truth and embarked on a transformative journey to reclaim their time and efficiency. Let’s explore how a custom-built automation process not only saved them over 40 hours per month but also relieved the stress of last minute report builds.
From Manual to Magical: The Starting Point
Before the winds of automation swept through their operations, the owners of Two Ten found themselves entangled in a labyrinth of manual data collection. Gathering retail traffic data was a laborious task, involving scraping and entering over 4,600 data points each week. These figures were meticulously organized into four weekly reports and a comprehensive month-end report. The intricate dance of data continued as they recorded, cleaned, manipulated, and visualized the information within an Excel spreadsheet.
But that wasn’t the final act. The visualizations then found their way into PowerPoint documents, serving as the ultimate presentation to their clients. This cumbersome process not only devoured valuable hours but also introduced the ever-looming specter of manual errors and stressful intervention.
A Symphony of Transformation: Process and Impact
Enter CDA, armed with a vision to streamline, enhance, and revolutionize Two Ten’s data reporting. Leveraging Amazon’s S3 Bucket, Python scripting, Amazon Athena, and Tableau, a custom automated process was crafted. The impact was nothing short of remarkable:
- Savings Beyond Imagination: The automation process proved to be a monetary and temporal boon. Over $50,000 per year was reclaimed through the newfound efficiency, boasting an impressive ROI of 8:1. A process that once swallowed over 40 hours each month was now distilled into mere minutes.
- Bidding Farewell to Manual Errors: Automation is the antidote to manual error. By eradicating the need for manual data recording, cleaning, and manipulation, the risk of reporting errors was significantly diminished. The result? A trustworthy stream of data that laid the foundation for accurate insights.
- A Brand-Boosting Report: But the transformation didn’t stop at efficiency. CDA introduced a custom report that not only revolutionized the process but also aligned with Two Ten’s brand identity. This metamorphosis ensured that clients could effortlessly consume insights, elevating the overall experience.
A Testament to Transformation
In the words of JJ Perino, the visionary founder of Two Ten, “Overall great experience… this project will save us at least 10 hours per week once operational and tens of thousands of dollars per year.” The success of this endeavor isn’t just measured in saved time and enhanced efficiency. It’s a testament to the power of automation to reshape processes, elevate brand experiences, and drive business success.
The case of Two Ten serves as a beacon for businesses navigating the challenges of manual operations. Through innovative automation, the future is brimming with possibilities – where laborious hours are reclaimed, errors are minimized, and brands are uplifted. The journey from manual to magical is one that paves the way for efficiency, growth, and excellence. Make sure to check out our other case studies to understand how CDA can help you maximize your data analytics results.
Related Articles We Think You Would Enjoy Next
A Data Analytics Approach to Optimal Warehouse Coverage
Data analytics helps warehouse operators be data driven. Find out how.
Read More
Beyond Basic Books: How Tableau Dashboards Enhance QuickBooks Data
QBO reports leave a lot to be desired. How can Tableau fix this?
Read MoreUnlock the Power of Your Data with Our Reporting Consulting Service! Are you drowning in data but struggling to extract actionable insights? Our team of experts specializes in transforming raw data into clear, concise, and impactful reports. Book a time with one of our knowledgeable experts to get started.