
As an American-made manufacturer, you've relentlessly optimized your production line, yet three hidden wastage points beyond your view still threaten your profitability and even your business survival.
Read MoreDecoding Your Customers’ Actions With Propensity Modeling
Wouldn’t it be great to have a crystal ball that told you what your customers were thinking? The quest to comprehend the minds of consumers has always been a top priority for businesses seeking to thrive in a rapidly evolving market. Fortunately, with propensity models this aspiration is no longer an unreachable dream.
Enter the world of propensity modeling – an innovative approach that empowers businesses to unravel intricate patterns of customer behavior and unlock invaluable insights. In this article, we embark on a journey into the realm of propensity modeling, where data-driven magic merges with real-world application, revolutionizing the way we understand and engage with our customers.
In this article you will learn about what a propensity model is, why propensity models are important, the process of implementing a model, and a case study on using a propensity model.
What is a propensity model?
Propensity modeling is a statistical approach used to predict the likelihood of a specific event occurring based on historical data. By analyzing past behaviors and interactions, a propensity model identifies relevant factors that are highly indicative of the event occuring. Propensity modeling enables businesses and organizations to make informed decisions, optimize strategies, and intervene proactively to influence customer behaviors in their favor.
Whether it’s forecasting customer conversions, predicting churn rates, or understanding the drivers behind certain actions, propensity models offer valuable insights that empower companies to enhance customer experiences, allocate resources efficiently, and stay ahead in a competitive marketplace. The next section will discuss in more detail the types of problems propensity models address.
Why are propensity models important?
Propensity models play a pivotal role in harnessing the potential of data analytics to predict future outcomes. By analyzing historical data and identifying patterns, these models enable businesses to anticipate the likelihood of specific events occurring. Let’s delve into some compelling use cases that highlight their significance.
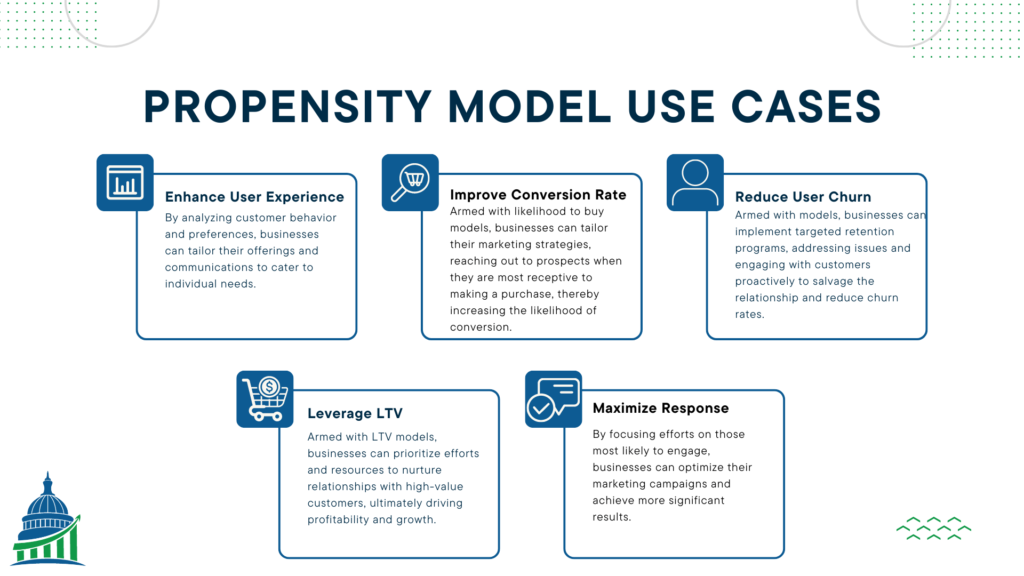
- Enhance User Experience through Personalization
In a world where consumers seek personalized experiences, propensity models emerge as a game-changer. By analyzing customer behavior and preferences, businesses can tailor their offerings and communications to cater to individual needs. This level of personalization not only boosts customer satisfaction but also fosters brand loyalty, creating a win-win scenario for both businesses and their clientele. Improve Conversion Rates
Efficiently allocating marketing resources and targeting the right audience is crucial for optimizing conversion rates. Propensity models, such as the “Likelihood to Buy” model, leverage data points like website visits, marketing touchpoints, and form fills to identify potential buyers. Armed with this information, businesses can tailor their marketing strategies, reaching out to prospects when they are most receptive to making a purchase, thereby increasing the likelihood of conversion.Reduce User Churn
Customer retention is a top priority for any business seeking sustainable growth. The “Churn” propensity model helps identify customers who may be at risk of ending their relationship with the company. Armed with this foresight, businesses can implement targeted retention programs, addressing issues and engaging with customers proactively to salvage the relationship and reduce churn ratesLeveraging LTV Propensity Models
Customer lifetime value (LTV) is a critical metric for understanding the overall value of a customer to a business. LTV propensity models predict the value of a customer at any stage of their lifecycle, allowing businesses to segment customers based on their potential value. Armed with this knowledge, businesses can prioritize efforts and resources to nurture relationships with high-value customers, ultimately driving profitability and growth.Response/Engagement Modeling
In a world where resources are limited, efficiency is key. Response modeling, another form of propensity modeling, forecasts the likelihood of a person responding to marketing efforts such as mailers, emails, or outbound calls. By focusing efforts on those most likely to engage, businesses can optimize their marketing campaigns and achieve more significant results.
As you can see propensity models solve many business problems and can be a valuable part of your business. Before you can take advantage of the benefits of a model you need to understand what it takes to build and implement a model. The next section gives you the steps involved in building and using a propensity model.
how do you implement a propensity model?
The steps for propensity model implementation can be seem in general in the image below. The section outlines these steps in more detail.
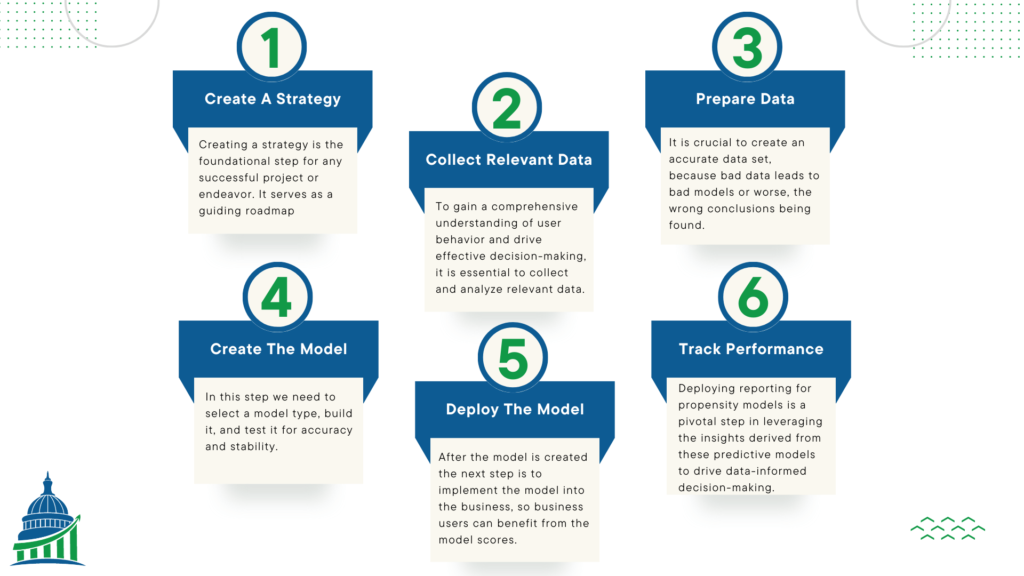
Creating a Strategy
Creating a strategy is the foundational step for any successful project or endeavor. It serves as a guiding roadmap, steering the course towards desired outcomes. Rushing into a project without a well-thought-out strategy can lead to wasted resources, missed opportunities, and uncertain results. Therefore, it is essential to begin by clearly defining the project’s goals, understanding the levers that can be utilized to achieve those goals, and establishing measurable success levels. Ultimately, investing time and effort into developing a comprehensive strategy ensures a more purposeful, efficient, and successful journey towards accomplishing project milestones.
Collecting Relevant Data
To gain a comprehensive understanding of user behavior and drive effective decision-making, it is essential to collect and analyze relevant data. This data serves as the backbone for statistical modeling and empowers businesses to design targeted intervention strategies. Let’s explore the different types of data that play a crucial role in this process.
- Demographic Data: Understanding customer demographics is vital for tailoring products and services to specific target audiences. This data includes information such as age, gender, location, marital status, education level, and other relevant factors that help businesses cater to diverse customer needs effectively.
- Behavioral Data: Analyzing past actions and interactions with the company or website provides insights into customer behavior. This data encompasses purchase history, browsing behavior, click-through rates, frequency of visits, and time spent on specific pages, allowing businesses to personalize experiences and enhance customer satisfaction.
- Transactional Data: Details about a customer’s past purchases, including the types of products or services bought, purchase frequency, average transaction value, and purchase recency, offer valuable insights into consumer preferences and shopping patterns.
- Customer Service Interactions: Data from customer support interactions, including call center logs, chat transcripts, and email communications, offers invaluable information about customer sentiment and satisfaction. Analyzing this data helps in identifying areas for improvement and optimizing customer service experiences.
- Response to Marketing Campaigns: Data related to a customer’s response to previous marketing campaigns, such as email open rates, click-through rates, and conversions, offers insights into the effectiveness of different marketing initiatives.
- Survey Data: Customer survey responses and feedback forms provide direct insights into preferences, opinions, and areas for improvement, guiding businesses in refining their offerings and enhancing customer experiences.
Collecting relevant data from multiple sources enables businesses to build a robust foundation for statistical modeling, gain profound insights into user behavior, and implement data-driven strategies that lead to better customer experiences and overall success. After you identify useful data you need to clean the data. This is discussed in more detail in the next section.
Preparing Data for Modeling
Data preparation is the step that takes 80% of the effort in building and deploying a propensity model. It is crucial to create an accurate data set, because bad data leads to bad models or worse, the wrong conclusions being found. This process involves collecting, cleaning, and transforming raw data into a format suitable for statistical analysis and modeling. Here’s an overview of the steps involved in preparing data for a propensity model:
Data Cleaning and Preprocessing:
Data collected from diverse sources may contain errors, missing values, or inconsistencies, which can significantly impact the model’s accuracy. Cleaning and preprocessing the data involve identifying and handling missing values, removing duplicate entries, and correcting any discrepancies. Additionally, outlier detection and treatment are essential to prevent skewed model outcomes due to extreme data points.
Feature Engineering:
Feature engineering is a crucial step in data preparation, as it involves selecting and creating relevant variables (features) that contribute significantly to the propensity model’s predictive power. This process may involve transforming variables, creating interaction terms, and selecting relevant subsets of data to enhance the model’s ability to capture patterns and relationships.
Creating and Testing a Model
Your extensive efforts in the previous step of preparing the data makes this step possible. In this step we need to select a model type, build it, and test it for accuracy and stability. Propensity models encompass a variety of statistical approaches, each selected based on the data structure, distribution, and desired output format. We will focus on two types of models in this article, logistic regression and random forests. Below you will find the strengths and weaknesses of each model.
Logistic regression, a fundamental propensity model, has a long-standing history in experimentation. It is easy to interpret, because each feature is assigned a coefficient tied to its effect on the outcome. Moreover, it delivers swift results due to relatively simple math. However, logistic regression performs best with data that are not overly complex.
In contrast, random forests are built on combining the decisions of multiple users and finding the most likely choice. They exhibit greater adaptability and robustness, accommodating various data types without necessitating encoding. Moreover, random forests implicitly perform feature selection, simplifying the modeling process. Yet, these models can be computationally intensive, especially for large datasets, and their “black box” nature offers limited control over their decision-making process, making it challenging to discern why specific trees performed better or were assigned higher weights. Nonetheless, random forests are recognized as catch-all solutions for many classification problems due to their versatility and efficiency across diverse datasets.
After you select a model type you will build the model using a tool like R, Python, or SAS. This building process is beyond the scope of this article, but a trained Statistician or Data Scientist should be employed to do this properly.
Deploying the Model
After the model is created the next step is to implement the model into the business. These steps should be outlined in the data strategy to ensure that the business users can benefit from the model scores. A common deployment strategy is to score a customer file using a decile ranking. Deciling scores from a model allow you to break the customer file up into groups representing 10% of the total customers. This approach helps to more efficiently target the top and bottom performing groups in your list and to track them more efficiently in the next step.
Here is an example of how this works. You have a list of customers that you want to know who is the most likely to buy your product. You built a model that answers this and you score the customers using the model. You then order the customers by score and break them into groupings representing 10% of the total list size. Now You know you can only market to 20% of the total file. So, you take group 1 and group 2 which are the most likely 20% of customers to purchase and you focus your attention on them.
Quadrant scoring can also be an effective method of implementation. Check out our other article that discusses this in more detail.
Performance Tracking
Deploying reporting for propensity models is a pivotal step in leveraging the insights derived from these predictive models to drive data-informed decision-making. Through effective reporting, businesses can communicate the model’s outcomes and predictions in a clear and concise manner, making it accessible to key stakeholders and decision-makers. The reporting should encompass relevant performance metrics, such as accuracy and business impact, to gauge the model’s effectiveness and identify areas for improvement.
Visualizations, charts, and dashboards can further enhance the understanding of the model’s predictions, enabling stakeholders to identify trends and patterns easily. Overall, deploying robust reporting for propensity models fosters a data-driven culture within the organization and facilitates strategic actions that optimize customer experiences, drive growth, and deliver tangible results.
propensity model case study
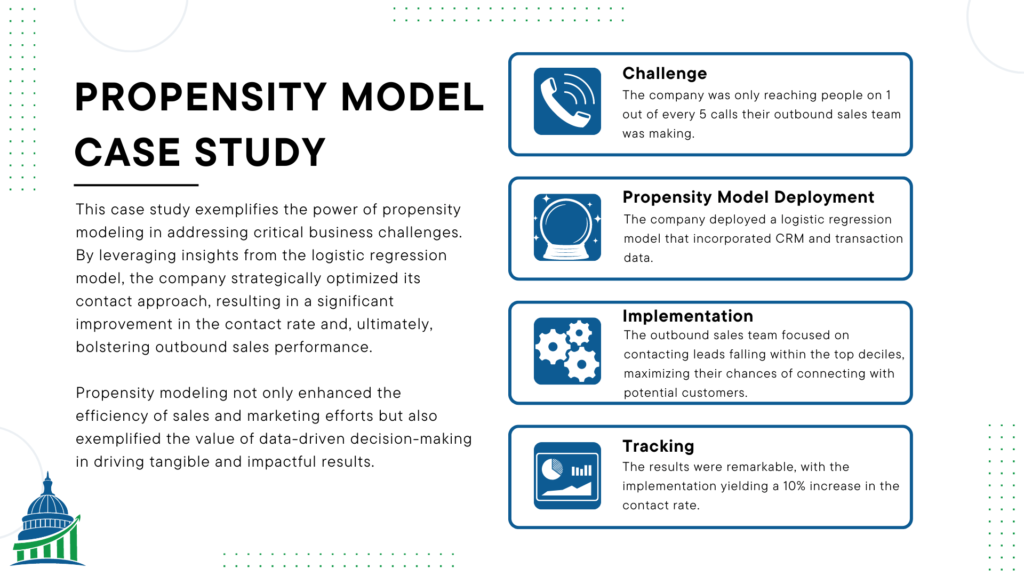
Challenge
A company’s outbound sales team faced the challenge of effectively reaching potential customers, with only one out of every five calls successfully making contact. Increasing the contact rate was crucial to boost sales, as the team had limited time to connect with leads.
A company’s outbound sales team faced the challenge of effectively reaching potential customers, with only one out of every five calls successfully making contact. Increasing the contact rate was crucial to boost sales, as the team had limited time to connect with leads.
Propensity Model Deployment
To address this issue, the company deployed a logistic regression model that incorporated CRM and transaction data. The CRM data included variables such as time since last sale, days since last contact, and transactions. The model’s predictions revealed significant disparities among deciles, with the top decile displaying an impressive 50% contact rate, while the bottom decile lagged at 17%.
Implementation and Outcome
Armed with the propensity model’s insights, the company implemented a strategic approach to optimize contact efforts. The outbound sales team focused on contacting leads falling within the top deciles, maximizing their chances of connecting with potential customers. Meanwhile, marketing efforts targeted the remaining deciles, using alternative channels such as email to reach out.
Tracking and Validation
To ensure the model’s continued efficacy, the propensity scores were integrated into the database, categorizing calls accordingly. To verify the model’s performance, a portion of lower decile leads was fed into the high decile campaigns, allowing for real-time tracking and comparison. The results were remarkable, with the implementation yielding a 10% increase in the contact rate.
This case study exemplifies the power of propensity modeling in addressing critical business challenges. By leveraging insights from the logistic regression model, the company strategically optimized its contact approach, resulting in a significant improvement in the contact rate and, ultimately, bolstering outbound sales performance. Propensity modeling not only enhanced the efficiency of sales and marketing efforts but also exemplified the value of data-driven decision-making in driving tangible and impactful results. Make sure to check out our other case studies to understand how CDA can help you maximize your data analytics results.
Related Articles We Think You Would Enjoy Next
A Data Analytics Approach to Optimal Warehouse Coverage
Data analytics helps warehouse operators be data driven. Find out how.
Read More
Decoding Your Customers’ Actions With Propensity Modeling
Propensity models are a group of statistical models that provide immense value to your organization.
Read Morewant to gain the benefits of a Propensity model but need someone to do it for you? Book a call to talk with one of our experts and we would love to help.