Reporting is often the most overlooked piece of data analytics. Reporting is the key cog in the data analytics.
Read MoreRethinking Automation Beyond Excel for More Effective Reporting
Report automation is the cornerstone of efficiency and insights for businesses. For years, Microsoft Excel has been the go-to tool for this task, because of its accessibility and familiar interface. However, as the business world evolves, the question arises: is Excel still the best option for report automation? This article explores alternatives to Excel for report automation. Our journey is guided by a singular purpose: to uncover tools and methods that not only match the capabilities of Excel but surpass them in efficiency, reliability, and scalability.
At the heart of our discussion the idea: While Excel has earned its reputation as a staple in report automation, the landscape of analytics has expanded. In this new world, more advanced solutions have emerged, offering a suite of features that better cater to the diverse needs of modern businesses. These solutions promise not just to maintain the status quo but to elevate the standards of report automation, paving the way for more sophisticated, secure, and scalable data handling.
As we embark on this exploration, I invite you to reconsider what you know about report automation and to open your mind to the possibilities that lie beyond the familiar gridlines of Excel.
The Limitations of Using Excel for Report Automation
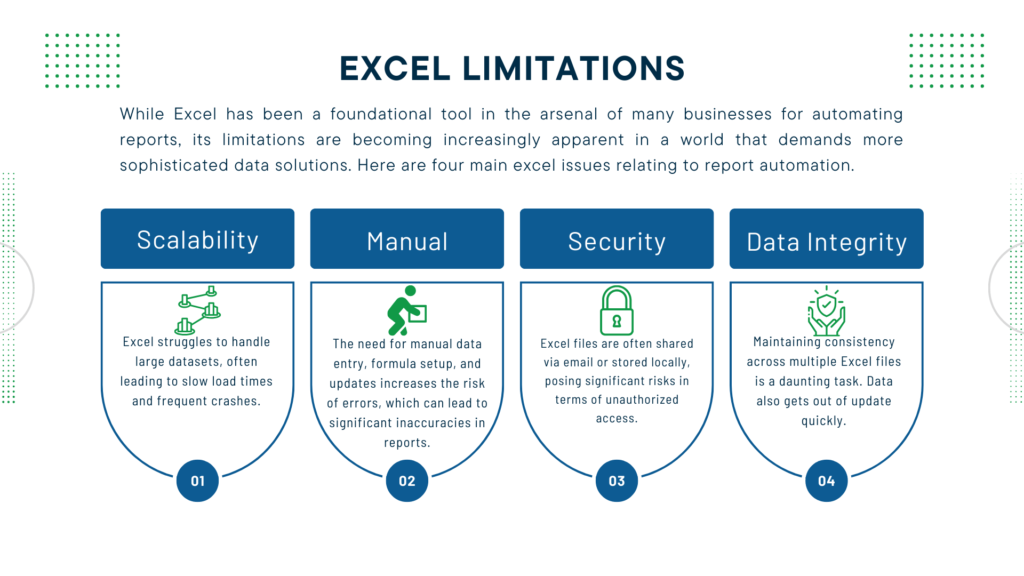
While Excel has been a foundational tool in the arsenal of many businesses for automating reports, its limitations are becoming increasingly apparent in a world that demands more sophisticated data solutions. In this section we will explore four main issues with excel being used in report automation.
Scalability Issues
A primary limitation of Excel is its scalability. Excel struggles to handle large datasets, often leading to slow load times and frequent crashes. This inefficiency is exacerbated when complex formulas and macros are applied, making Excel an unsuitable choice for report automation. Often times workbooks can start small but over time the become bloated with new data and processes which lead to these performance issues.
Error-Prone Manual Processes
The manual processes inherent in Excel are prone to human error. The need for manual data entry, formula setup, and updates increases the risk of errors, which can lead to significant inaccuracies in reports. These errors not only consume valuable time in correction but can also lead to misguided business decisions based on incorrect data. An example of this is when you see that something doesn’t look quite right so you backtrack your work for an hour and realize you entered 117 instead of 17.
Security Concerns
Another critical concern with Excel is data security. Excel files are often shared via email or stored locally, posing significant risks in terms of unauthorized access. The lack of robust security measures within Excel makes sensitive data vulnerable to breaches, a risk that businesses cannot afford to take.
Data Integrity
Data integrity in Excel is also a challenge. The absence of a centralized data repository means that data can become outdated quickly, and maintaining consistency across multiple Excel files is a daunting task. This situation can lead to discrepancies in data and reports, raising questions about the reliability of the conclusions drawn from such analyses. An example of this is thinking you updated the calculation for revenue but a teammate saved a different version over yours, so the revenue calculation has been wrong for the past quarter.
In conclusion, while Excel has its strengths, its limitations in scalability, manual processes, security, and data integrity make it an impractical choice for report automation. The next sections will delve into more advanced alternatives, providing solutions that not only address these limitations but also enhance the overall efficiency and reliability of report automation.
Understanding the Need for Advanced Reporting Automation
In an era where data is king, the need for advanced reporting automation has never been more critical. This section explores what advanced reporting automation entails, its benefits, and why it’s essential.
Defining Advanced Reporting Automation
Advanced reporting automation encompasses not just the automated generation of reports but also the integration of on-time data, the use of interactive dashboards, and the implementation of scalable solutions that can grow with the business. This level of automation provides a dynamic platform for decision-making, where data is not just presented but brought to life through interactive dashboards that aid in understanding complex information quickly and accurately.
The Need for On-Time Data
The ability to access and analyze on-time data is invaluable. On-time data allows businesses to make informed decisions promptly, respond to market changes swiftly, and identify trends as they happen. Nothing is worse than identifying a trend after the fact, highlighting a missed opportunity.
Interactive Dashboards
Interactive dashboards offer a user-friendly interface where complex data is visualized through charts, graphs, and other dynamic elements. These dashboards provide a comprehensive view of the business at a glance, enabling quick interpretation and action on critical business metrics. Dashboards that use the LIVEN approach demonstrate these abilities.
Scalable Solutions for Growing Businesses
As businesses grow, so do their data needs. Advanced reporting automation offers scalable solutions that can accommodate increasing volumes of data and more complex reporting requirements. Scalability ensures that as a business expands, its reporting system can adapt, providing consistent and reliable performance without the need for frequent overhauls or replacements. You might only be tracking Salesforce data today, but tomorrow you might want to add QuickBooks data. Your system should be able to incorporate both without missing a beat.
Data Accuracy
Advanced reporting systems use sophisticated algorithms to reduce human error, ensuring that data is processed accurately. This accuracy is critical for making sound business decisions and maintaining credibility with stakeholders. Advanced systems put your mind at ease, knowing the data that shows up on the page is correct every time.
Security
Data security is paramount. Advanced solutions offer robust security measures to protect sensitive information from unauthorized access and breaches. This security extends to compliance with regulations such as GDPR, ensuring that businesses not only safeguard their data but also adhere to legal requirements.
In summary, advanced reporting automation represents a significant leap from excel, offering on-time data, scalability, accuracy and security. Its adoption is not merely an upgrade but a necessary evolution to stay competitive and agile in a data-driven world. The next section will explore the alternatives to Excel that embody these capabilities, offering businesses the tools they need to harness the full potential of their data.
Exploring Better Alternatives to Excel for Reporting Automation
In the previous section we laid out why it is imperative to seek alternatives to Excel. This section explores alternatives, highlighting their key features and showcasing real-world examples of successful transitions.
The four areas that Excel struggles with are scalability, error-prone manual processes, security concerns, and data integrity. In order to overcome these issues an ideal setup is a cloud database combined with a cloud business intelligence tool. At CDA we use AWS to create cloud databases and Tableau Cloud is our preferred BI tool. Below is an example setup of a system we use.
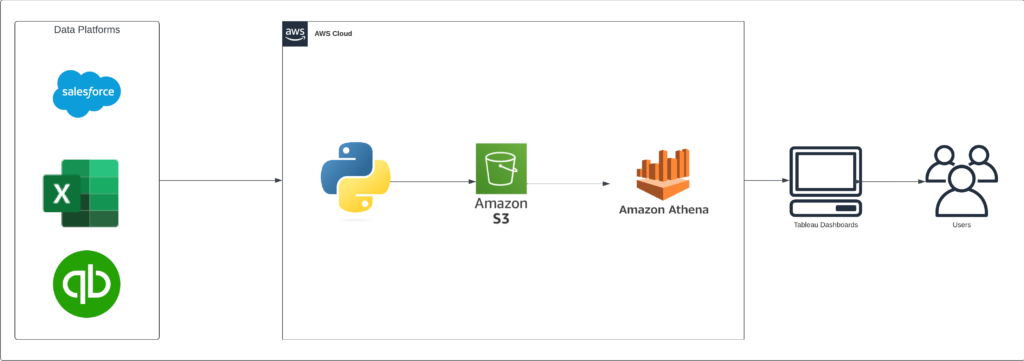
Cloud Database
- Scalability: Cloud databases support large amounts of data and can grow with you as your business grows and you add more data.
- Automated Processes: ETL scripts handle all the data uptake, formatting and calculations. This keeps manual errors out of your reporting system.
- Secure: AWS has many layers of security that control access and keep your data behind
Tableau
- Scalability: Custom reports can be built to answer any questions you have. Tableau also supports a variety of data connections, so if your data isn’t available in your cloud database you might still be able to bring it into your report.
- Data Accuracy: Data sources are built in AWS and then shared in Tableau. This keeps everyone working with the same data and using the same definitions for metrics. The data is also automatically updated to make sure it is up to date on whatever refresh cycle you need.
- Interactive Dashboards: Tableau dashboards are used to make data accessible and they allow the user to drill into their data finding those hidden nuggets with ease.
If you want more details about Tableau, check out our Tableau guide.
Now that you know what the alternatives to Excel are, lets dig in on some case studies where clients got out of Excel and into the system described above.
examples of moving on from excel
Now that you know what the alternatives to Excel are, lets dig into case studies where clients got out of Excel and into a similar system as described above.
XstremeMD (XMD), a leading medical services provider, faced the challenge of manually generating internal encounter reports and external return on investment reports for customers. CDA took on the task of recreating XMD’s reports within the Tableau platform while incorporating best-in-class data visualizations for better analysis. To support the reporting infrastructure, an RDS database was utilized, providing a reliable and scalable solution for data storage and retrieval. Automation of reports that eliminated $6,000 worth of manual effort per year. The data being available on time allowed the staff to gain insights worth an additional $114,000 for the year.
Two Ten owners spent a ton of their time collecting and combing through retail traffic data manually. They scraped and entered over 4,600 data points per week to build four weekly reports and a month end report. Two Ten recorded, cleaned, manipulated, and visualized the data in an Excel spreadsheet. CDA built a custom automated process leveraging Amazon’s S3 Bucket, Python, Amazon Athena, and Tableau. The automated reporting process takes minutes instead of days. Saves over $50,000 annually. Additionally, the reports allowed the owner to alleviate the stress of the weekly fire drill in completing the reports for clients.
The higher education client had multiple, inconsistent ad hoc reports from legacy systems across several siloed departments. A lack of one source of truth lead to admissions not being able to retarget prospects or have inconsistent enrollment forecasts. CDA built an Admissions forecast tool by connecting directly to the legacy CRM using an ODBC connection with Tableau. Automation of enrollment forecasting allowed the client to save $70,000 in manual effort a year and get data in a timely and accurate manner that led to increasing revenue by $40,000.
conclusion
In this article we explored the evolving landscape of report automation. We crossed the familiar terrain of Excel to the expansive possibilities offered by modern tools. This article outlined the vital need for small businesses to evolve their approach to reporting and data management. Below are a review of the key points of the article.
- Limitations of Excel: While Excel has been the old reliable standby, it has limitations in scalability, security, and is subject to error-prone manual processes.
- Advanced Reporting: Advanced reporting highlights the need for on time data analysis, interactive dashboards and scalable solutions.
- Alternatives to Excel: AWS tools and Tableau serve as perfect platforms to replace Excel and implement advanced reporting for your business.
Related Articles We Think You Would Enjoy Next
Why Do We Automate Reports
Report automation is a popular topic brought up in the business world. However, you are probably asking yourself why bother. You already have your reports...
Read MoreThe LIVEN Approach to Dashboarding
Dashboards are the lifeblood of business reporting, but how do you know that the dashboard you are building will be valuable...
Read More