
What a Slow Callback Actually Costs: The Close Rate Curve
How fast a lead gets its first call tracks with whether it signs. Across a full year of first time home improvement leads we measured, leads called within five minutes closed at 9.1%. After 30 minutes, the close rate fell to about 5% and stayed there. Here is the curve and how to compute yours.
A homeowner fills out your form at 7:40 on a Tuesday night. Your team calls the next morning, gets voicemail, and logs it. By Thursday the homeowner has signed with someone else, and nothing in your CRM says why. It just shows one more lead that “didn’t pan out,” the kind you start to suspect your marketing is full of.
Every owner has heard that you should call within five minutes. Fewer know that the research behind that advice, a 2007 study from a company that sold lead response software and a 2011 follow up in Harvard Business Review, measured whether companies reached and qualified a lead, not whether the lead ever became a sale. The question an owner actually cares about is the second one: does a slow callback cost signed jobs? We measured it on a full year of home improvement leads.
Does response time actually change whether a home improvement lead closes?
In the leads we measured, faster calls went with far more signed jobs. Leads called within five minutes closed at almost twice the rate of leads called between 31 minutes and two hours: 9.1% against 4.8%. The table shows a full year of first time leads, grouped by how long each lead waited for the first call.
| Time to first call | Share of leads | Close rate |
|---|---|---|
| Under 5 minutes | 36.2% | 9.1% |
| 6 to 10 minutes | 6.0% | 8.4% |
| 11 to 30 minutes | 11.8% | 5.8% |
| 31 minutes to 2 hours | 12.3% | 4.8% |
| 2 hours to 1 day | 16.0% | 4.6% |
| 2 days or more | 17.6% | 6.4% |
| All first time leads | 100% | 6.9% |
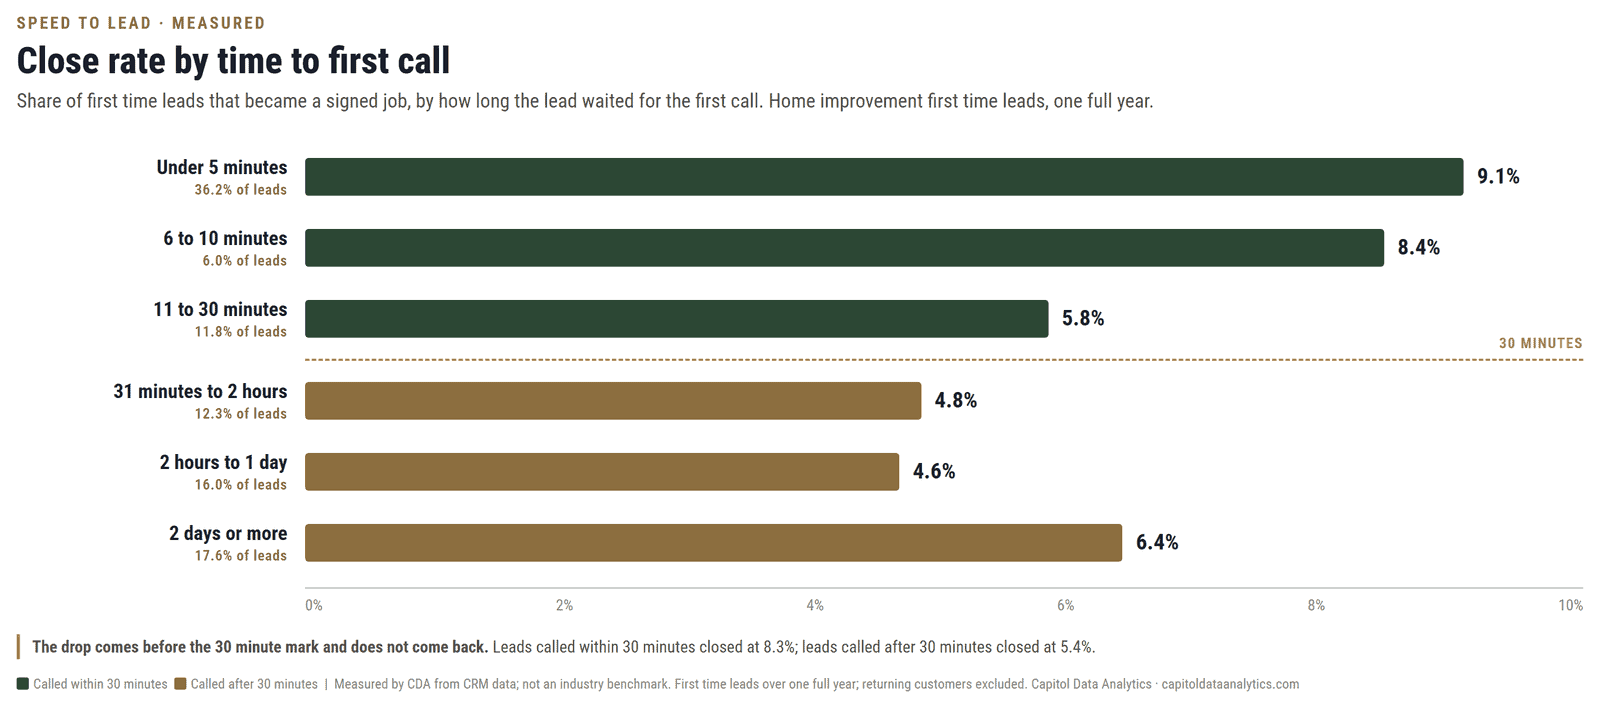
This is CDA’s own measurement from CRM data. It is not an industry benchmark, and your curve will sit higher or lower. The shape is the part worth checking against your own numbers.
Where does the close rate drop off?
The drop happens between 10 and 30 minutes, and past 30 minutes it never comes back. A lead called in six to ten minutes closed almost as often as one called in under five (8.4% against 9.1%). By the 11 to 30 minute window the rate had already slid to 5.8%, and every bucket after that sat between 4.6% and 6.4%.
We tested whether these gaps could be chance. Leads called within ten minutes closed at a higher rate than leads called at 11 to 30 minutes, and the odds of a gap that size appearing by chance are under 1 in 10,000. The small difference between under five minutes and six to ten minutes is not significant: those two windows close at about the same rate, and the gap between them could be chance. From 11 minutes out to a full day, the buckets do not differ from one another either. The curve is a step, not a slope: steady through ten minutes, lower after.
A cruder split at 30 minutes tells the same story. Leads called within 30 minutes closed at 8.3%. Leads called after 30 minutes closed at 5.4%, about a third lower. The likeliest reason is the one every owner suspects: a homeowner who waits an hour has time to call someone else. The data cannot prove that on its own, because fast and slow leads can differ in other ways, so the last section shows how to check it in your own numbers.
The rise in the last row is unlikely to be chance: leads that waited two days or more closed at 6.4%, measurably better than leads that waited a few hours. We did not break that bucket down, so we cannot say why; leads left that long may be a different kind of lead, such as homeowners who asked to be called later. It is no reason to let leads sit: it is still well below what the first ten minutes produced.
What does a slow callback cost in dollars?
If speed is what drives the gap, a slow callback costs the jobs you would have signed at the faster close rate, times your average ticket. The math takes three numbers you already have: how many leads wait past 30 minutes each month, the gap between your fast and slow close rates, and your average sale.
Here is an illustration, not a client result. Say 150 leads a month wait more than 30 minutes, and your fast leads close three points better than your slow ones (in the 30 minute split above, leads called within 30 minutes closed at 8.3% against 5.4% after, a gap of about three points). If speed is what drives the gap, that is about four or five signed jobs a month. At a $20,000 average ticket, that is up to $90,000 a month, and you already paid for every one of those leads.
That is why speed to lead is the first thing a free Profit Leak Audit measures: it puts your own curve and your own dollar figure on the table, from your CRM, before anyone suggests a fix.
How do you measure your own close rate curve?
You can build this table from your CRM in an afternoon. You need three fields per lead: when it was created, when the first outbound call went out, and whether it became a sale.
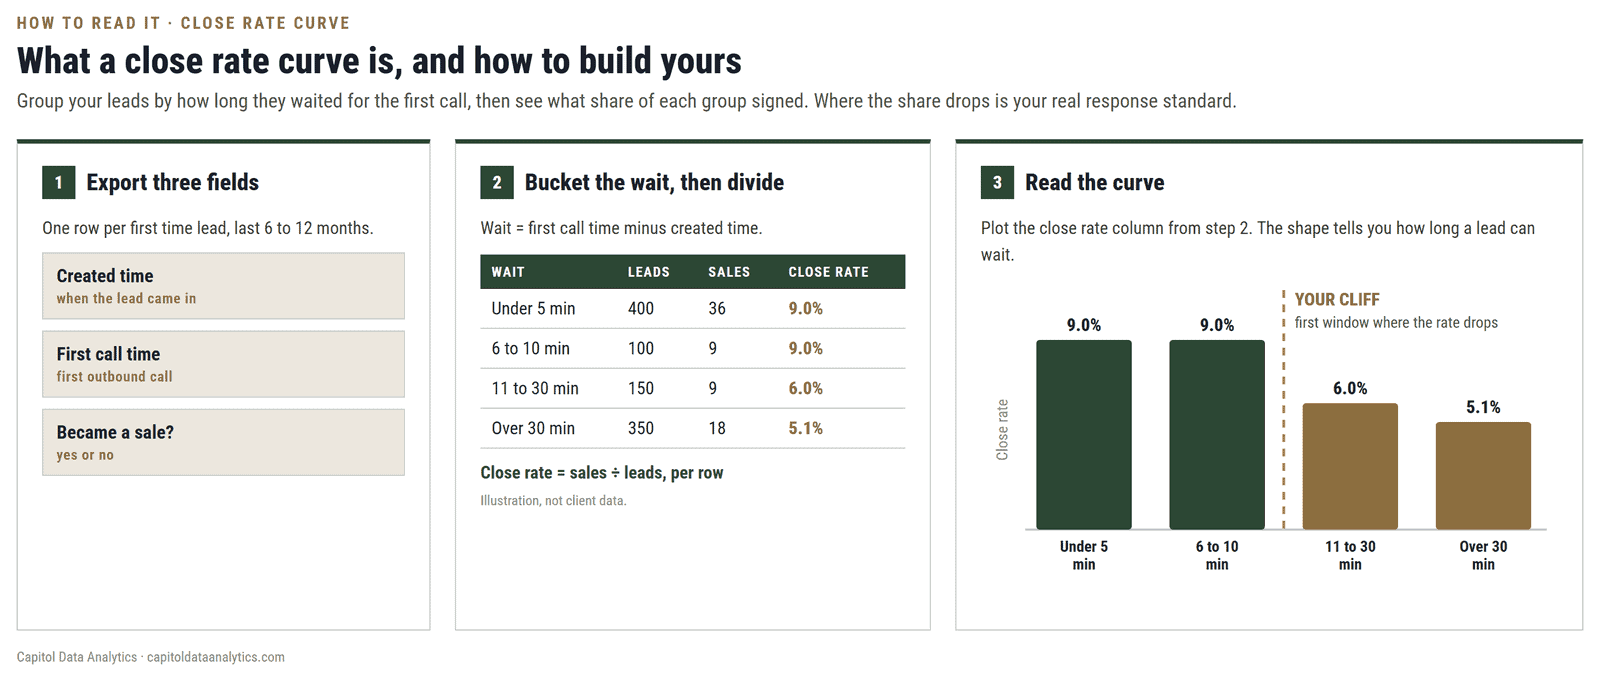
- Export first time leads. Take the last 6 to 12 months of new leads only. Returning customers close differently and will blur the curve.
- Compute the wait. For each lead, subtract the created time from the first call time. Count leads that were never called separately; they are part of the leak, but they have no wait to bucket.
- Bucket the waits. Use the same six windows as the table above, so you can compare: under 5 minutes, 6 to 10, 11 to 30, 31 minutes to 2 hours, 2 hours to a day, 2 days or more.
- Count leads and sales per bucket. Divide sales by leads for each bucket. That column is your curve.
- Find your cliff. Note the first bucket where the close rate drops noticeably. That is your real response standard, whatever the sign on the wall says.
- Put a dollar figure on it. Leads past the cliff each month, times the gap in close rate, times your average ticket. That number is what the next fix, a schedule change, a callback rule or an AI tool for after hours leads, has to beat.
Then make it a weekly number with one owner. In the KPIs each department should own, median speed to lead is the call center’s first measure for exactly this reason.
When is chasing speed the wrong fix?
Speed is the wrong fix when your own curve is flat. If leads called at minute 40 close about as often as leads called at minute three, your buyers are not shopping around in the first hour, and the money is leaking somewhere else: appointments that do not run, or sales that cancel.
Three situations to check before you reorganize the call center:
- Most of your leads are referrals or repeat customers. They often wait for you on purpose. Measure first time leads from paid sources separately.
- Your fast and slow leads come from different places. If web forms get called in minutes and a slower source sits overnight, part of the gap is the source, not the clock. Compare the curve within each source before you trust it.
- You cannot reach people at all. If contact rate is low no matter how fast you call, fix the phone numbers and the hours first. Speed cannot help a lead you never connect with.
How we measured this
The curve comes from CDA’s funnel analysis of home improvement CRM data: every first time lead created over one full year (around 15,000 leads), grouped by minutes from lead creation to the first outbound call, with a sale counted when the lead became a signed job. Returning customers were excluded. Differences between buckets were tested with two proportion z tests; we call a gap significant when the chance of it appearing by accident is under 5%, and the ten minute drop clears that by a wide margin (p < 0.0001). It is observational, not an experiment, so differences in lead source and time of day are not controlled for. Your numbers will differ.
Frequently asked questions
Does response time affect close rate for home improvement leads?
In the leads we measured, faster calls went with far more signed jobs. Across a full year of first time home improvement leads, leads called within five minutes closed at 9.1%, and leads called between 31 minutes and two hours closed at 4.8%. The drop came between 10 and 30 minutes, and the close rate never recovered after that.
What is a good speed to lead for a home improvement company?
Under five minutes for every new inbound lead, and track the share that waits past 30 minutes, not just the median. In the data we measured, leads called at six to ten minutes closed at nearly the same rate as leads called within five, while leads called after 30 minutes closed about 40% less often than leads called within five minutes. Measure your own curve to find where your cliff is, then set your standard just before it.
How much revenue does a slow callback cost?
Multiply three numbers: the leads that wait past your cliff each month, the gap between your fast and slow close rates, and your average ticket. As an illustration, 150 slow leads a month with a three point gap and a $20,000 ticket is up to $90,000 a month in jobs at stake, if speed is what drives the gap.
How do I measure close rate by response time?
Export your first time leads with three fields: created time, first outbound call time and whether the lead became a sale. Subtract to get the wait, group the waits into buckets such as under 5 minutes, 6 to 10, 11 to 30 and over 30, then divide sales by leads in each bucket. The first bucket where the rate drops is your real response standard.
Is the five minute rule backed by research?
The five minute figure comes from a 2007 study by a lead response software company, which found leads called within five minutes were far more likely to be reached and qualified than leads called at 30 minutes. A 2011 Harvard Business Review article by the same lead researcher found a similar drop within the first hour. Neither measured sales. Close rates by response time have to come from your own CRM, which is what this page shows.
See your own close rate curve
If you would rather see your own curve before you change anything, a free Profit Leak Audit pulls it from your CRM, puts a dollar figure on the leads that wait too long, and shows whether speed is your biggest leak or not. The findings are yours either way.
Get your free Profit Leak Audit